In January 2024, the SEC's approval of 11 Bitcoin spot ETFs, including ones from Fidelity and BlackRock, marked a finance milestone. BlackRock's iBit hit $5 billion, Fidelity's reached $4 billion, and ARK's surpassed $1 billion in assets.
Koyfin provides tools to precisely track and analyze the rising interest in these financial instruments.
Accessing and Utilizing Fund Flow Data on Koyfin
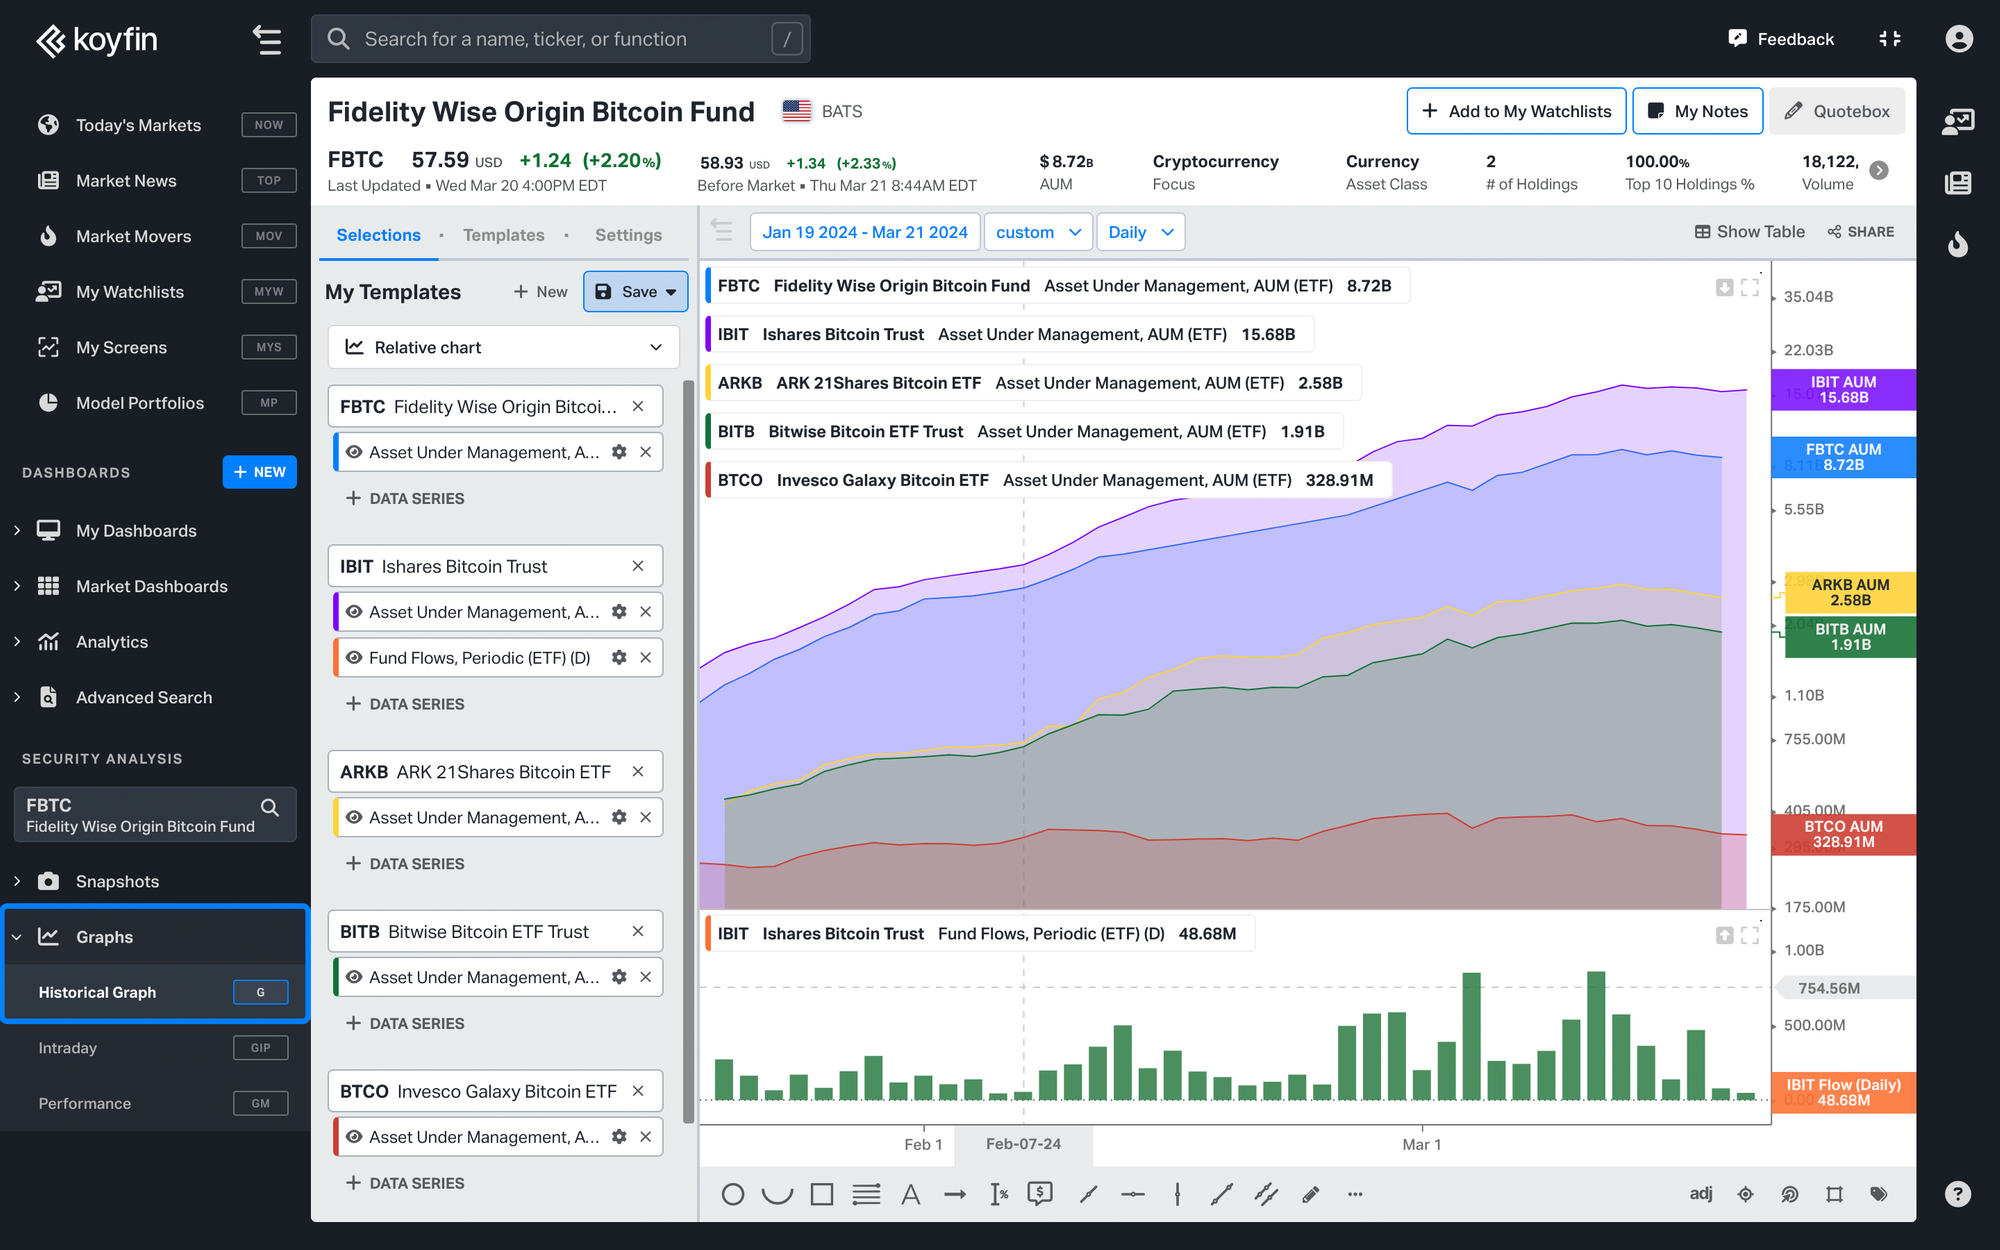
1. ETF Fund Flow Graph Visualisation: Koyfin's chart format simplifies ETF fund flow analysis, allowing users to search for tickers like FBTC and access specific data series, including flows, shares outstanding, and NAV discounts.
For comprehensive guidance on using graphs, please see our graph-related article.
2. Watchlist Creation and Customization: Create a new watchlist, such as "Bitcoin ETFs," and import relevant tickers. Customize your watchlist columns to display essential data, including AUM and fund flows.
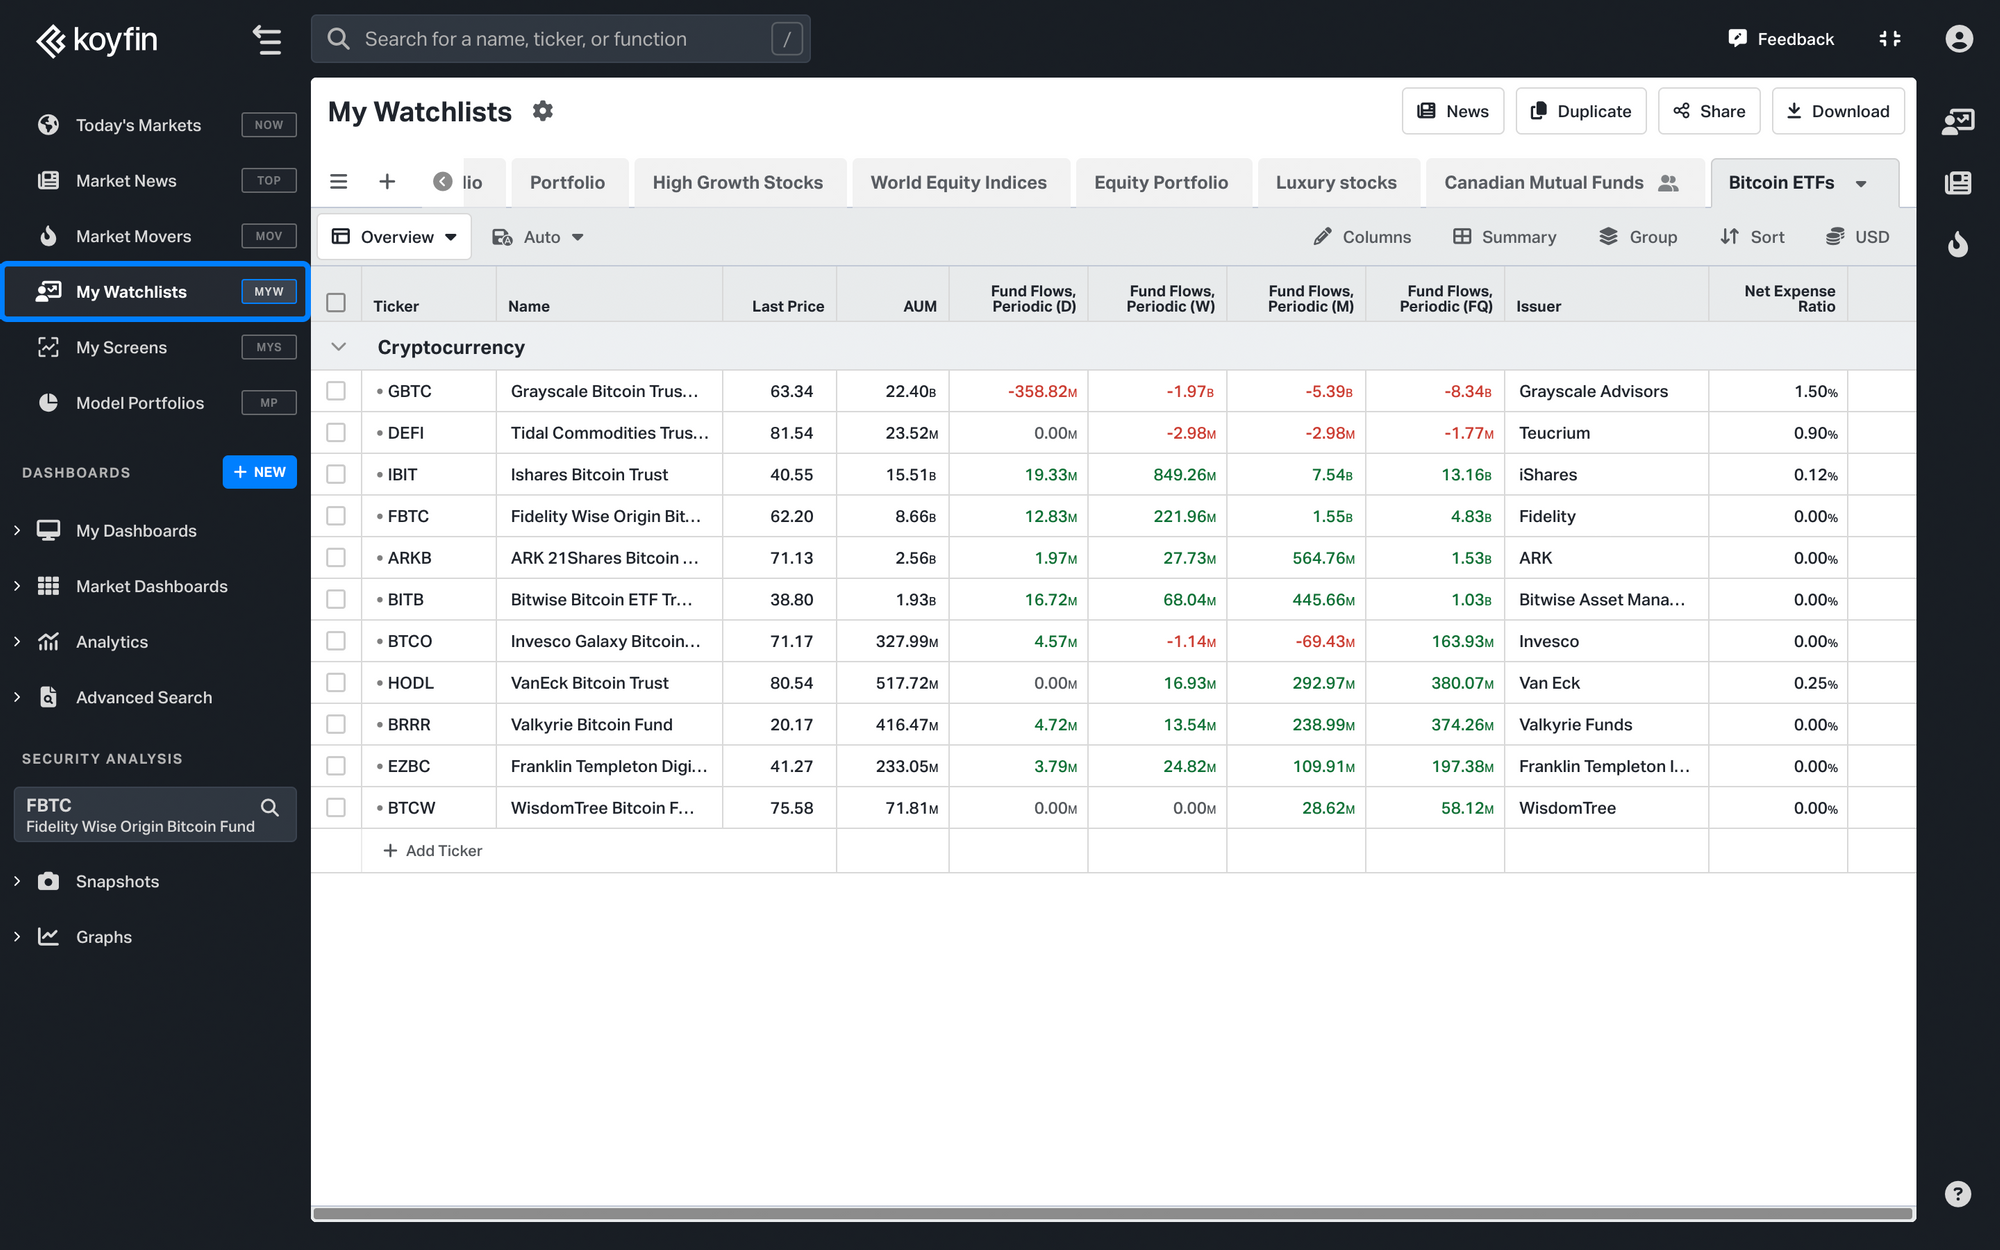
For an in-depth exploration of managing watchlists, please refer to our watchlist article.
3. Dashboard Development: Move on to building a dashboard that integrates your watchlist and historical graphs among other analytical tools. Customize your dashboard to include visual representations like AUM trends and daily flow insights.
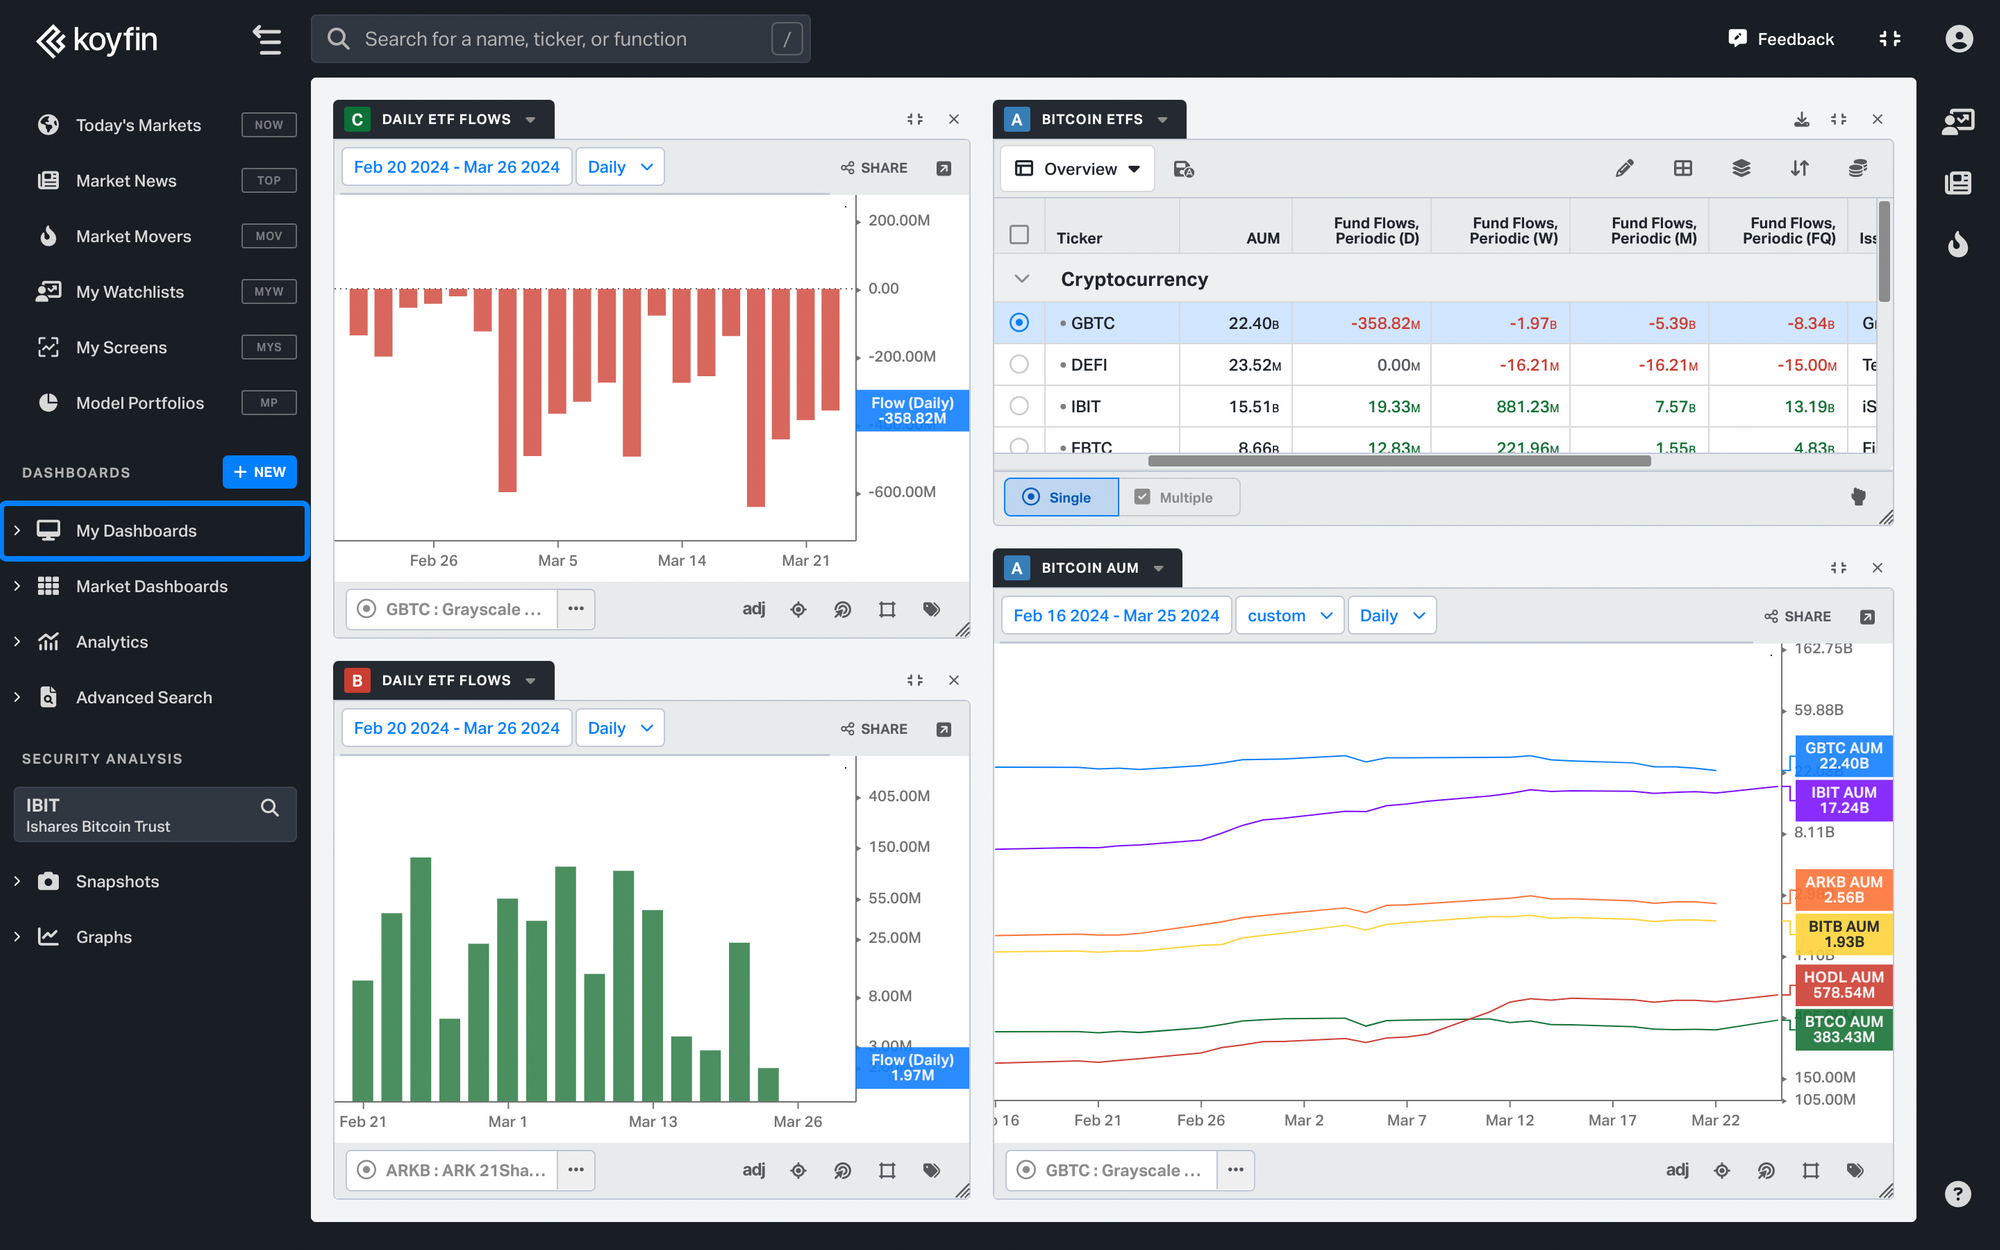
For detailed instructions on customizing dashboards, please visit our dashboard article.
Check out this video to get more information about Bitcoin ETF tracking.