Understanding the valuation of Exchange-Traded Funds (ETFs) is essential for making informed investment decisions. With Koyfin, you can easily add valuation multiples to your watchlists, screens, and charts to keep track of important metrics like Price/Earnings, Price/Sales, and EV/EBITDA. Whether you're analyzing data at your desk or on the go with the mobile app, these tools help you make more informed investment decisions. Start using ETF valuation metrics today to enhance your market analysis and stay ahead in your investment journey.
Note: ETF valuation is available only for U.S. ETFs. All plans include valuation for SPY, QQQ, and DIA. Access valuation for all U.S. ETFs with our Premium, Advisor Core or Advisor Pro plans. For more details, see our pricing page.
Graphing
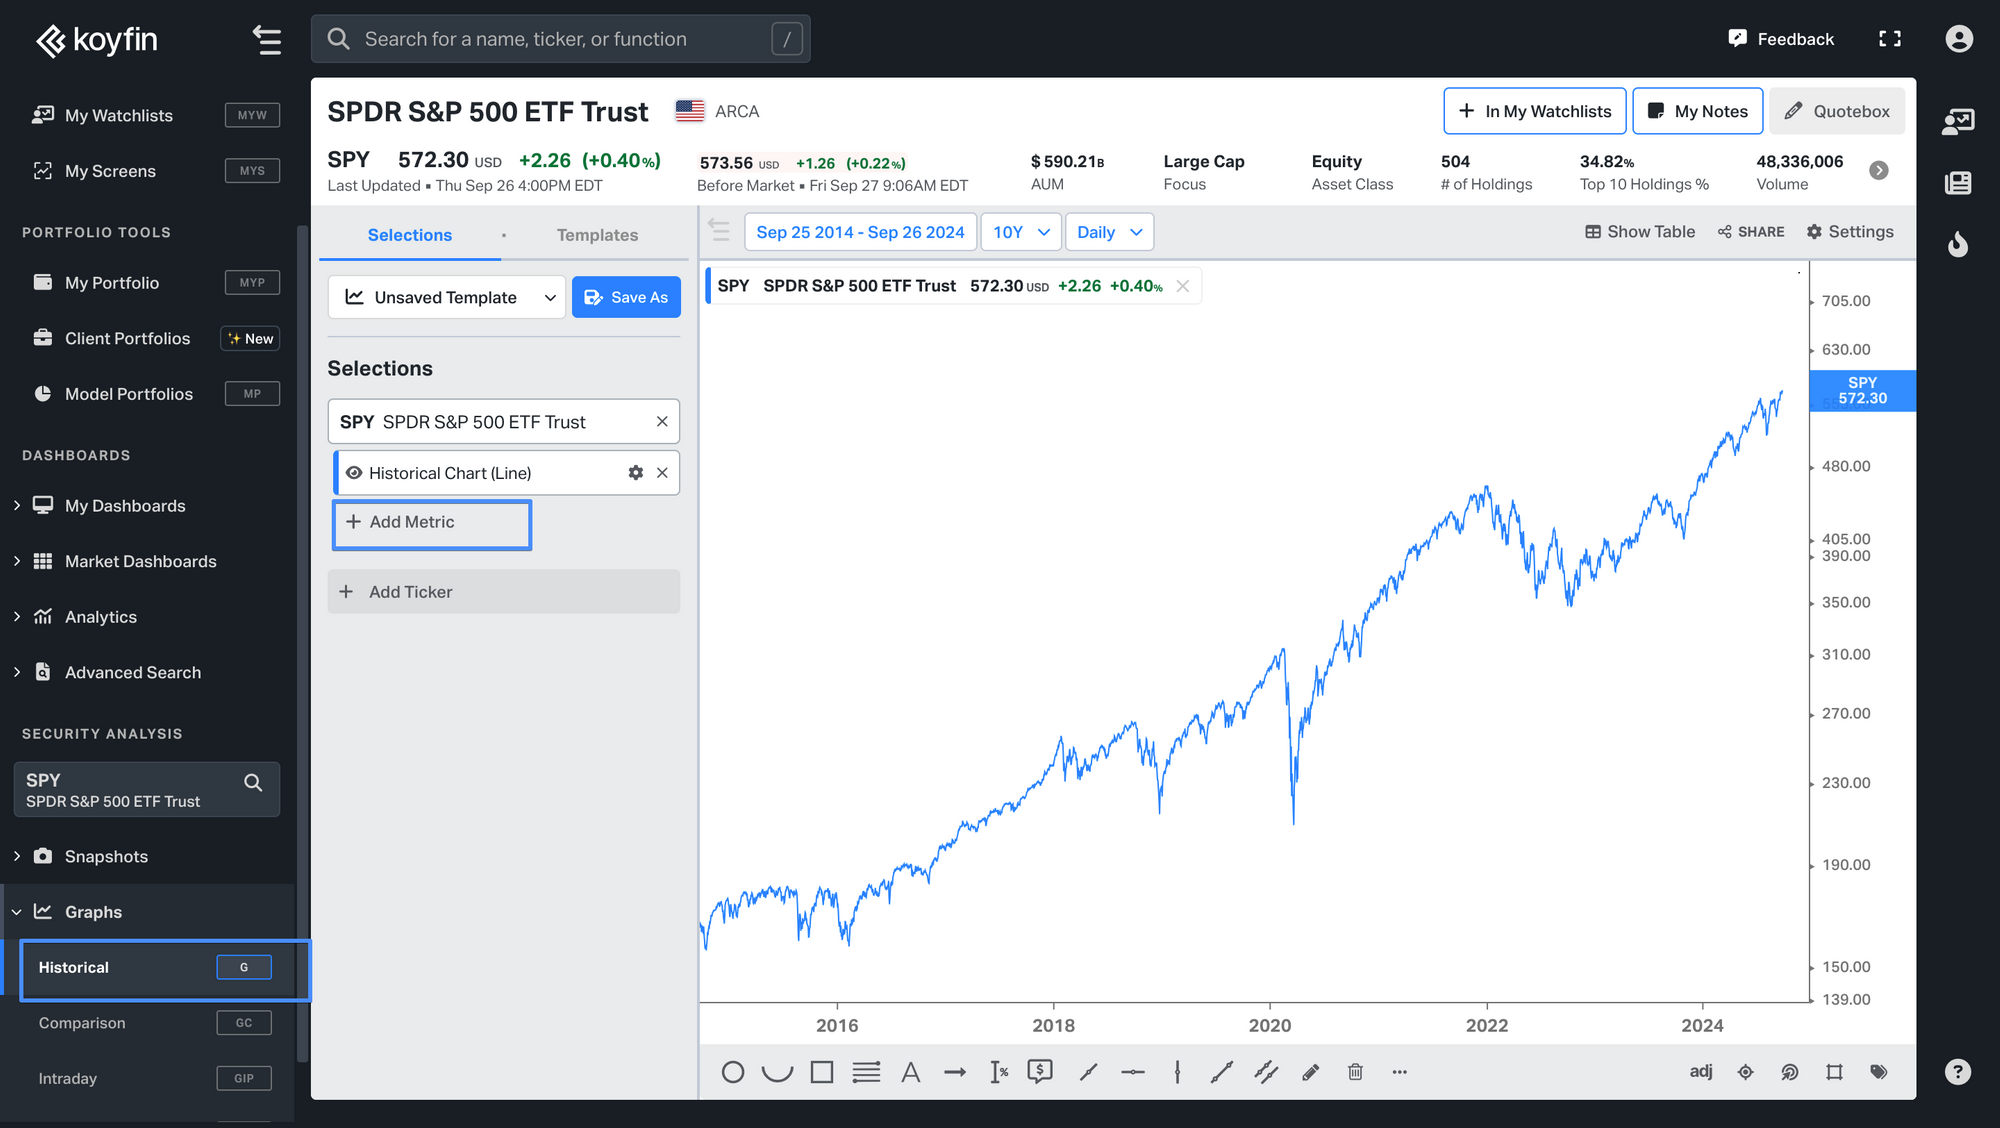
Visualizing valuation data in charts allows you to analyze trends and compare ETFs over time. By looking at valuation metrics on a graph, you can track changes, spot patterns, and find investment prospects. Here's how to visualize ETF valuation metrics in the Historical (G) chart:
- In the G chart, click on Add Metric.
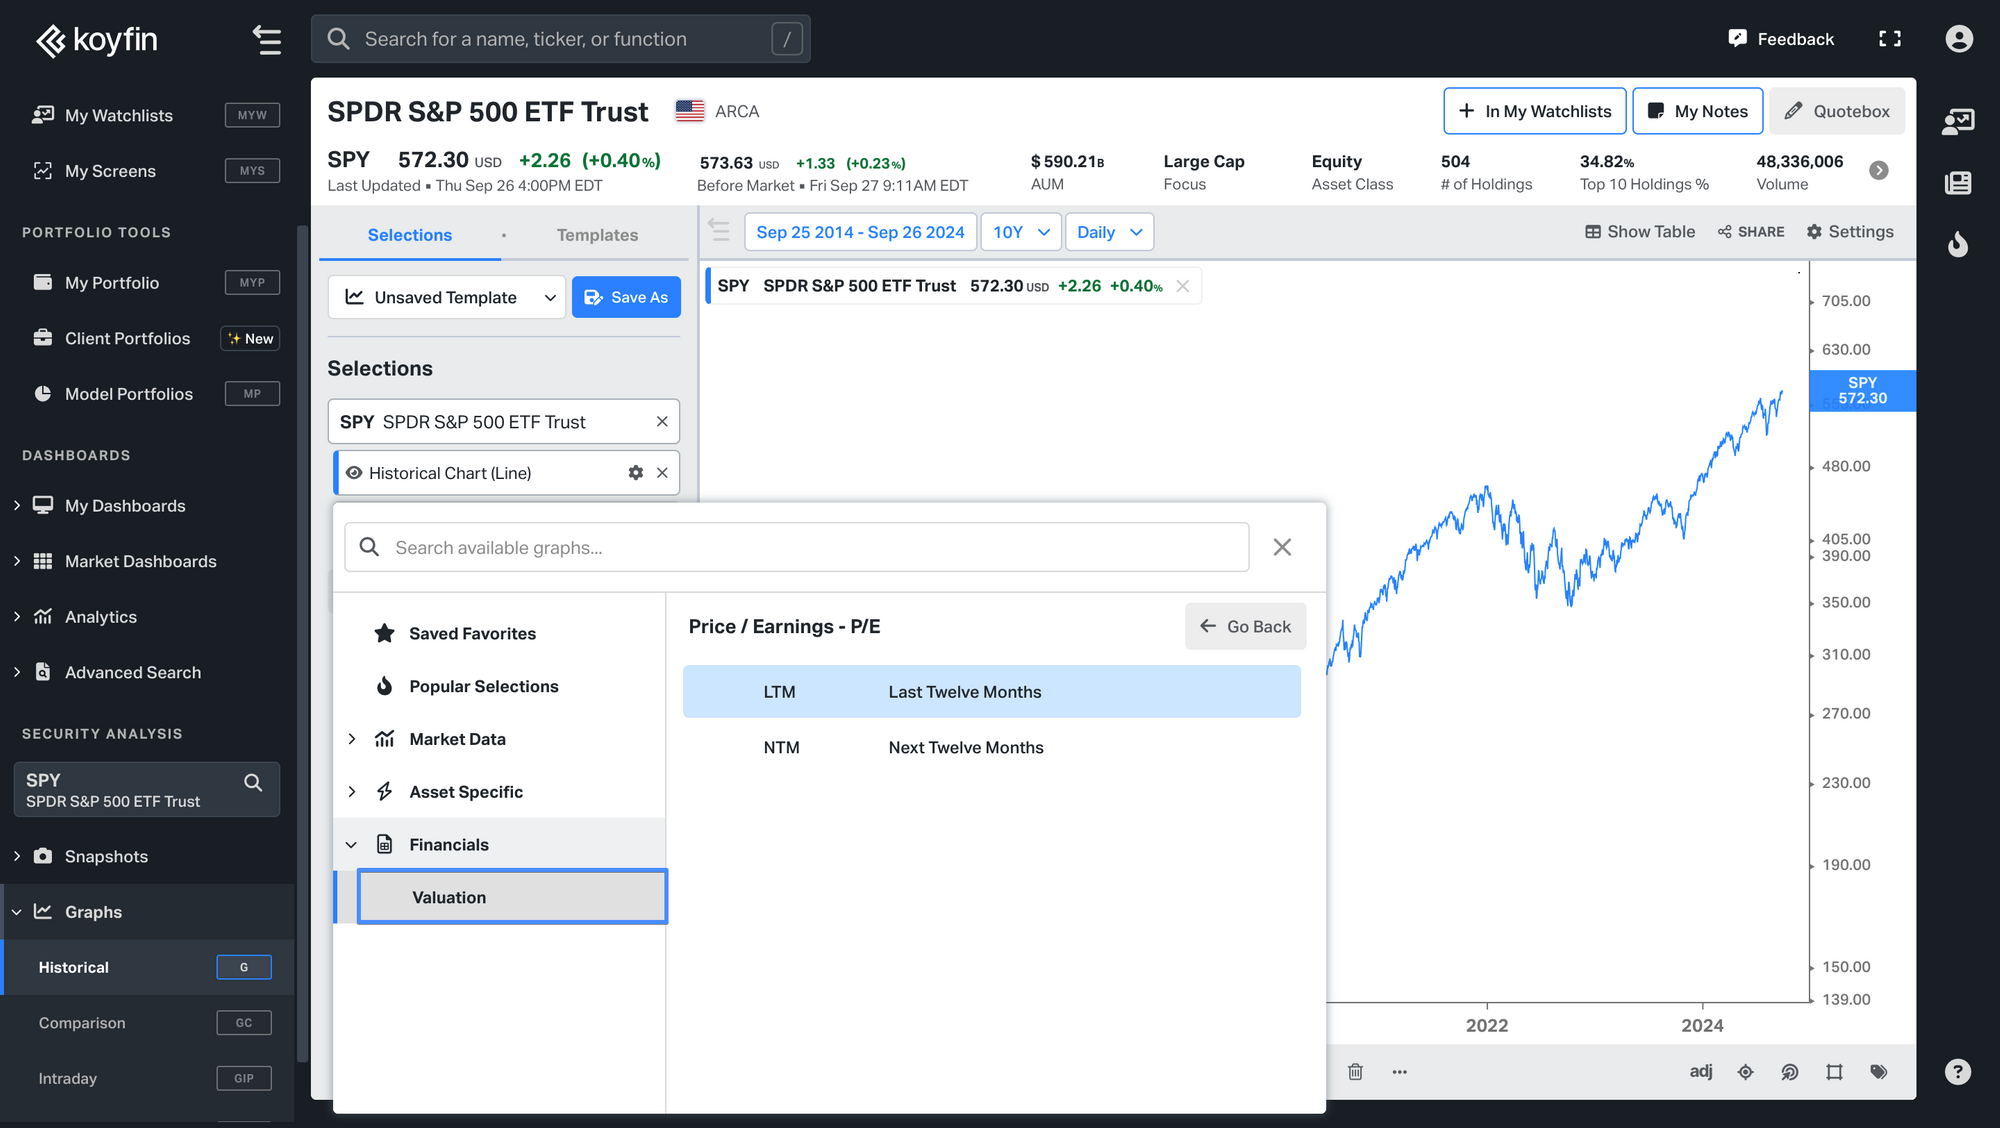
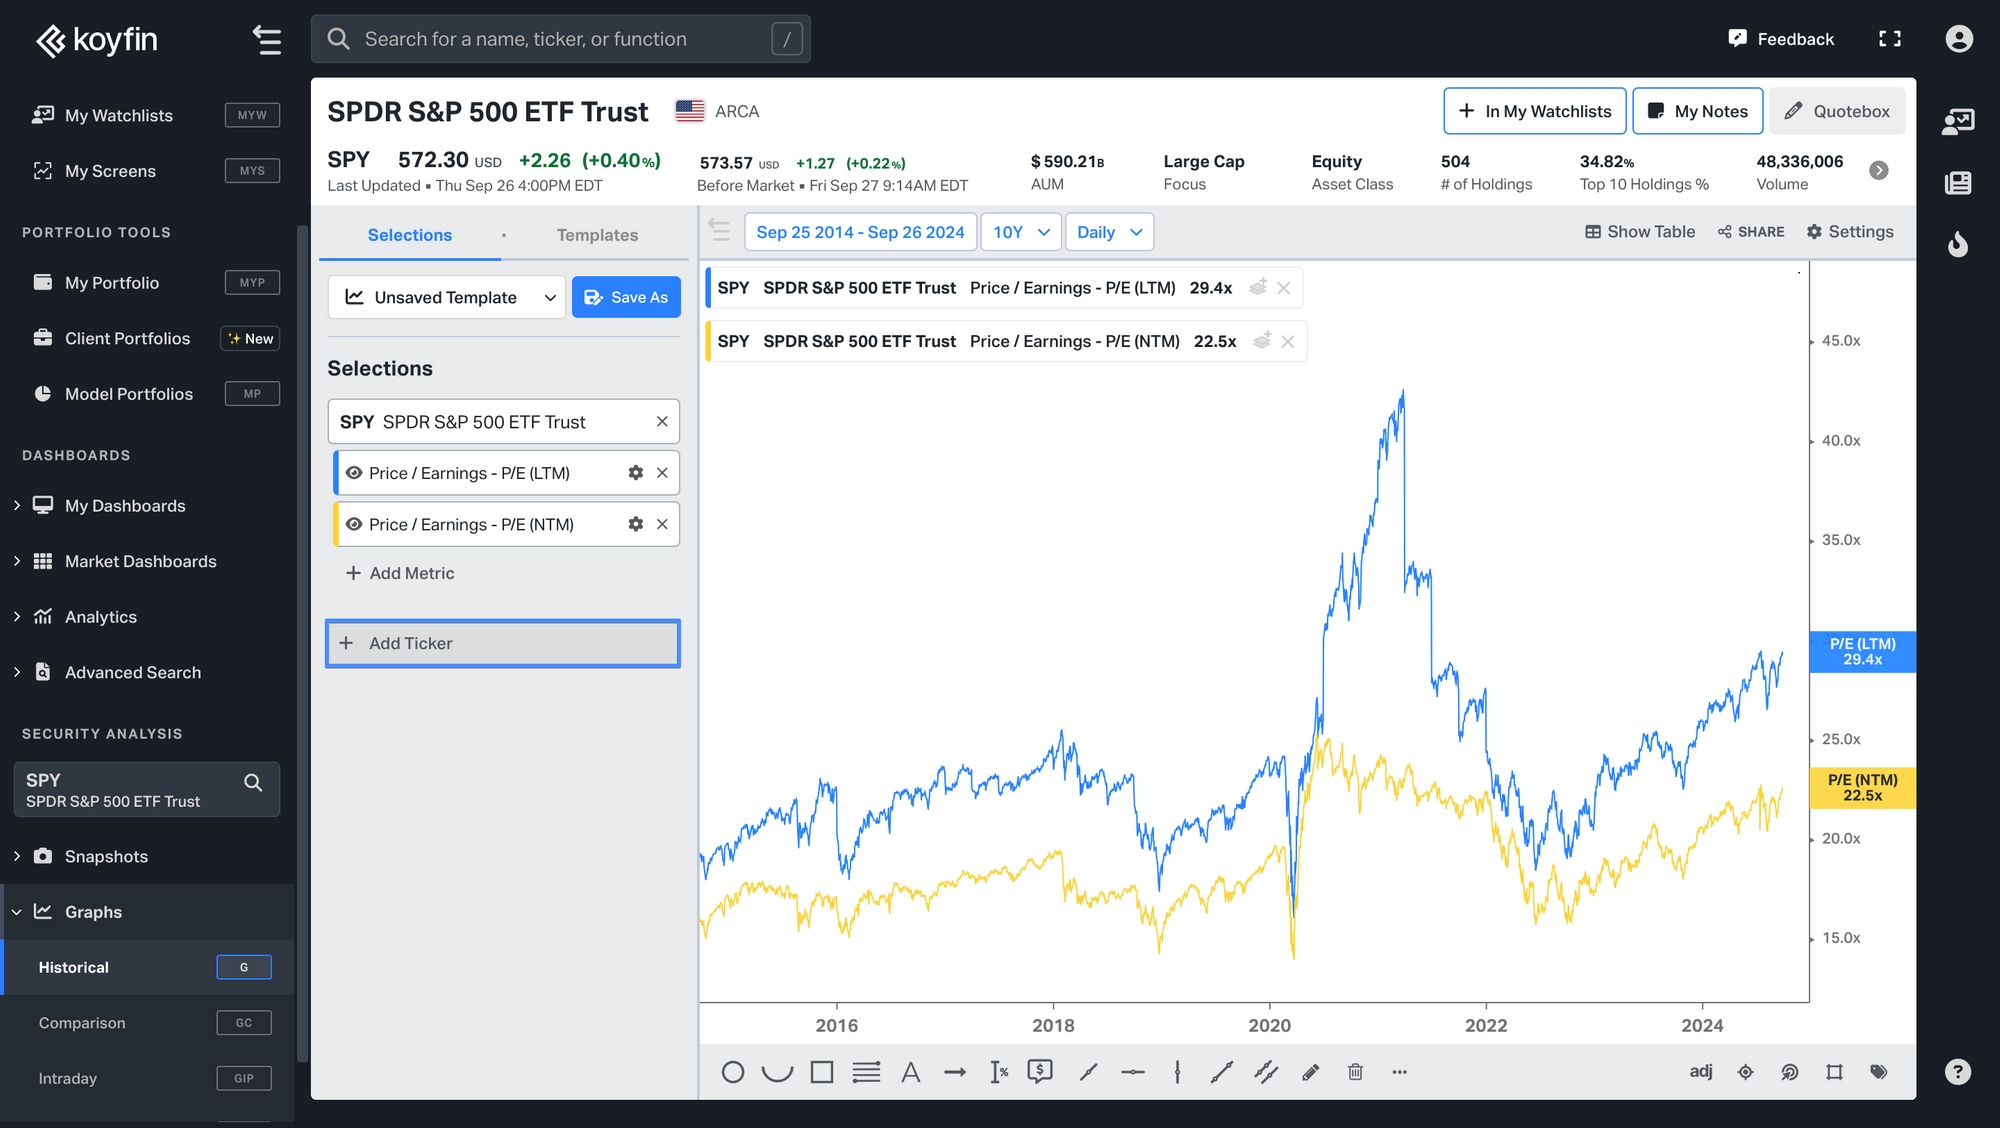
2. Navigate to Financials and then select Valuation. Choose the valuation metric you want to chart, such as Trailing Price/Earnings and Forward Price/Earnings.
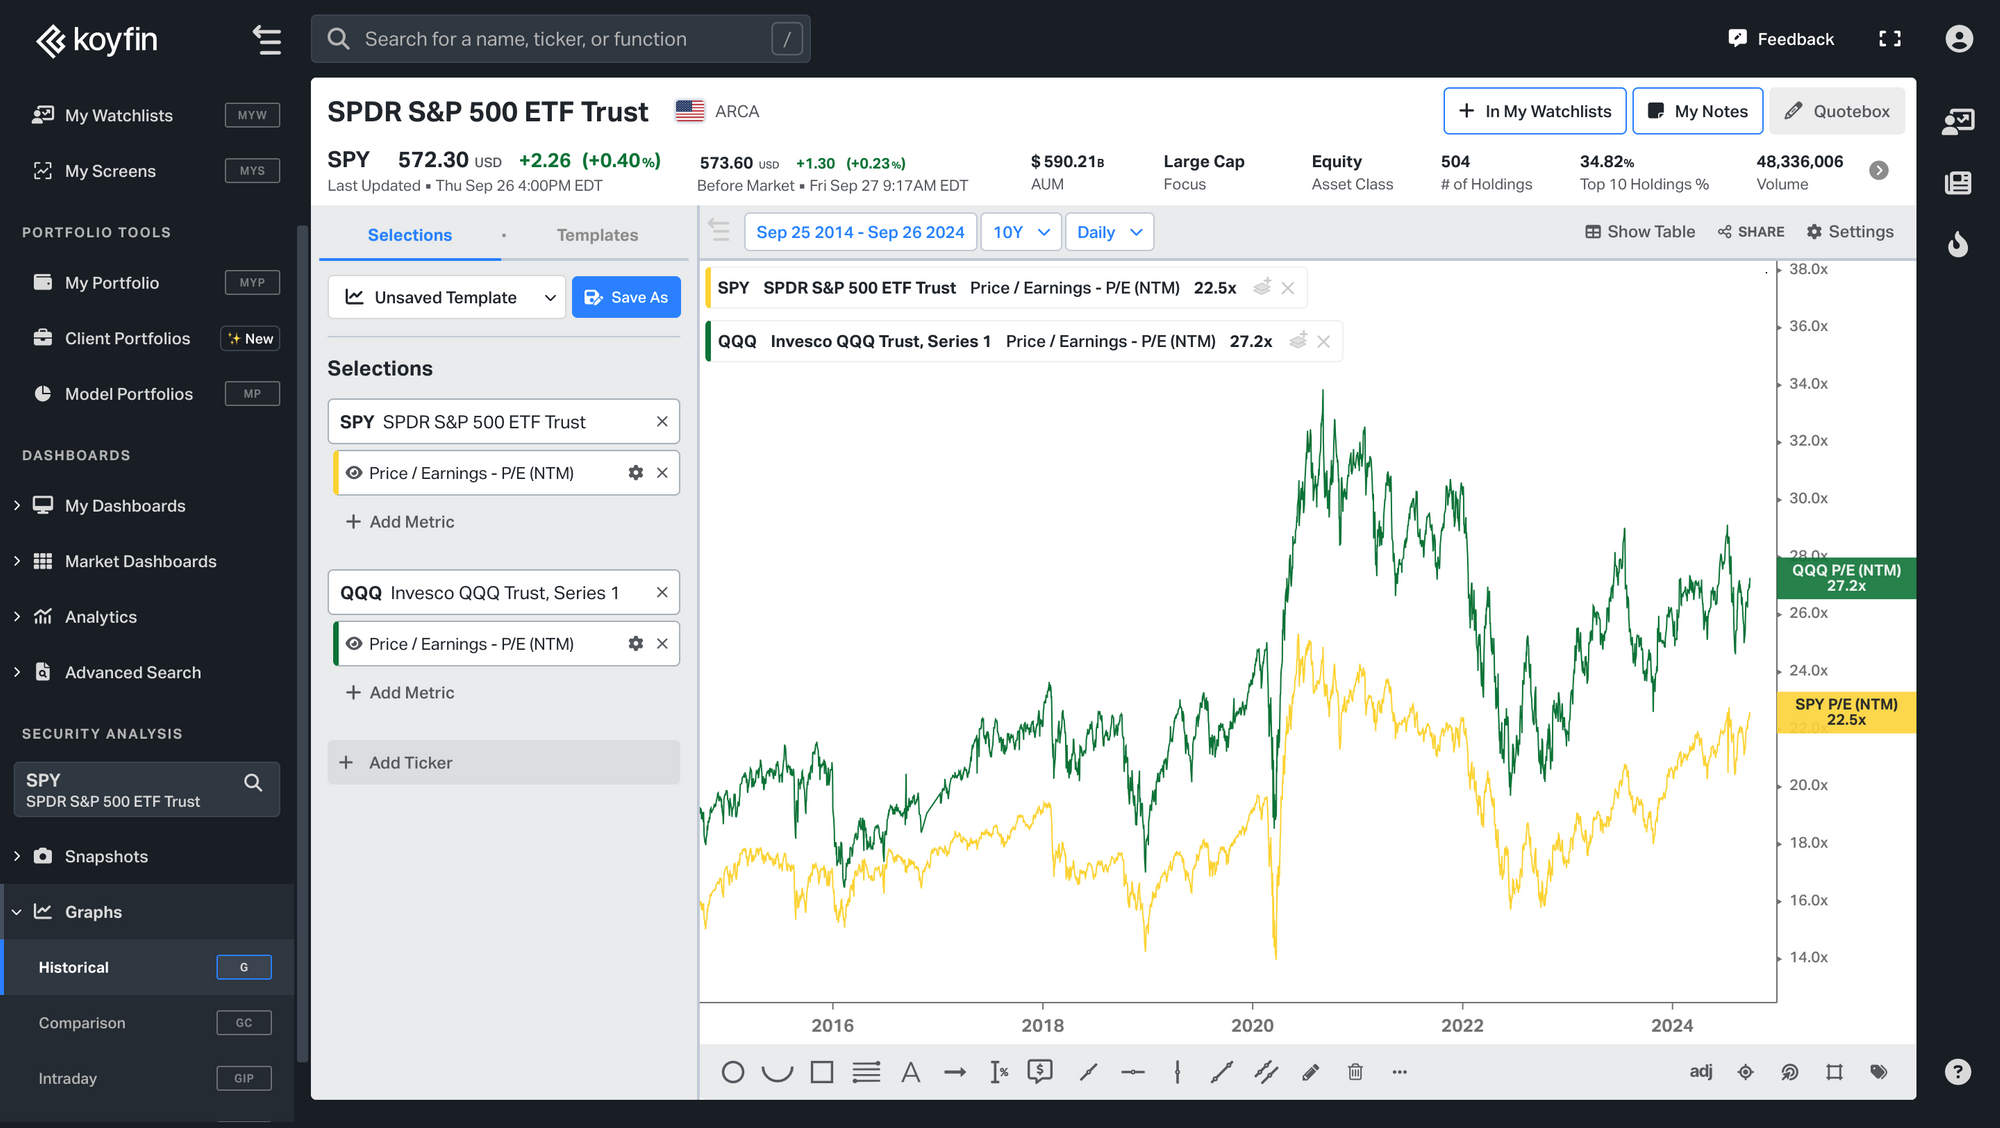
If you wish to compare multiple securities, add additional ETFs or stocks by clicking Add Ticker. This allows you to observe how the valuations of different ETFs or stocks have changed over time relative to each other.
For example, comparing the Forward Price/Earnings ratios of SPY (SPDR S&P 500 ETF Trust ETF) and QQQ (NASDAQ 100 ETF) can help you analyze differences and trends between these two major ETFs.
Watch this video for a comprehensive guide on how to visualize ETF valuations on charts.
My Watchlists
Adding valuation multiples to your watchlists allows you to monitor key financial metrics at a glance. By integrating valuation data directly into your watchlists, you can quickly assess the relative value of different ETFs or stocks without navigating through multiple pages. To enhance your watchlists with valuation data, follow these steps:
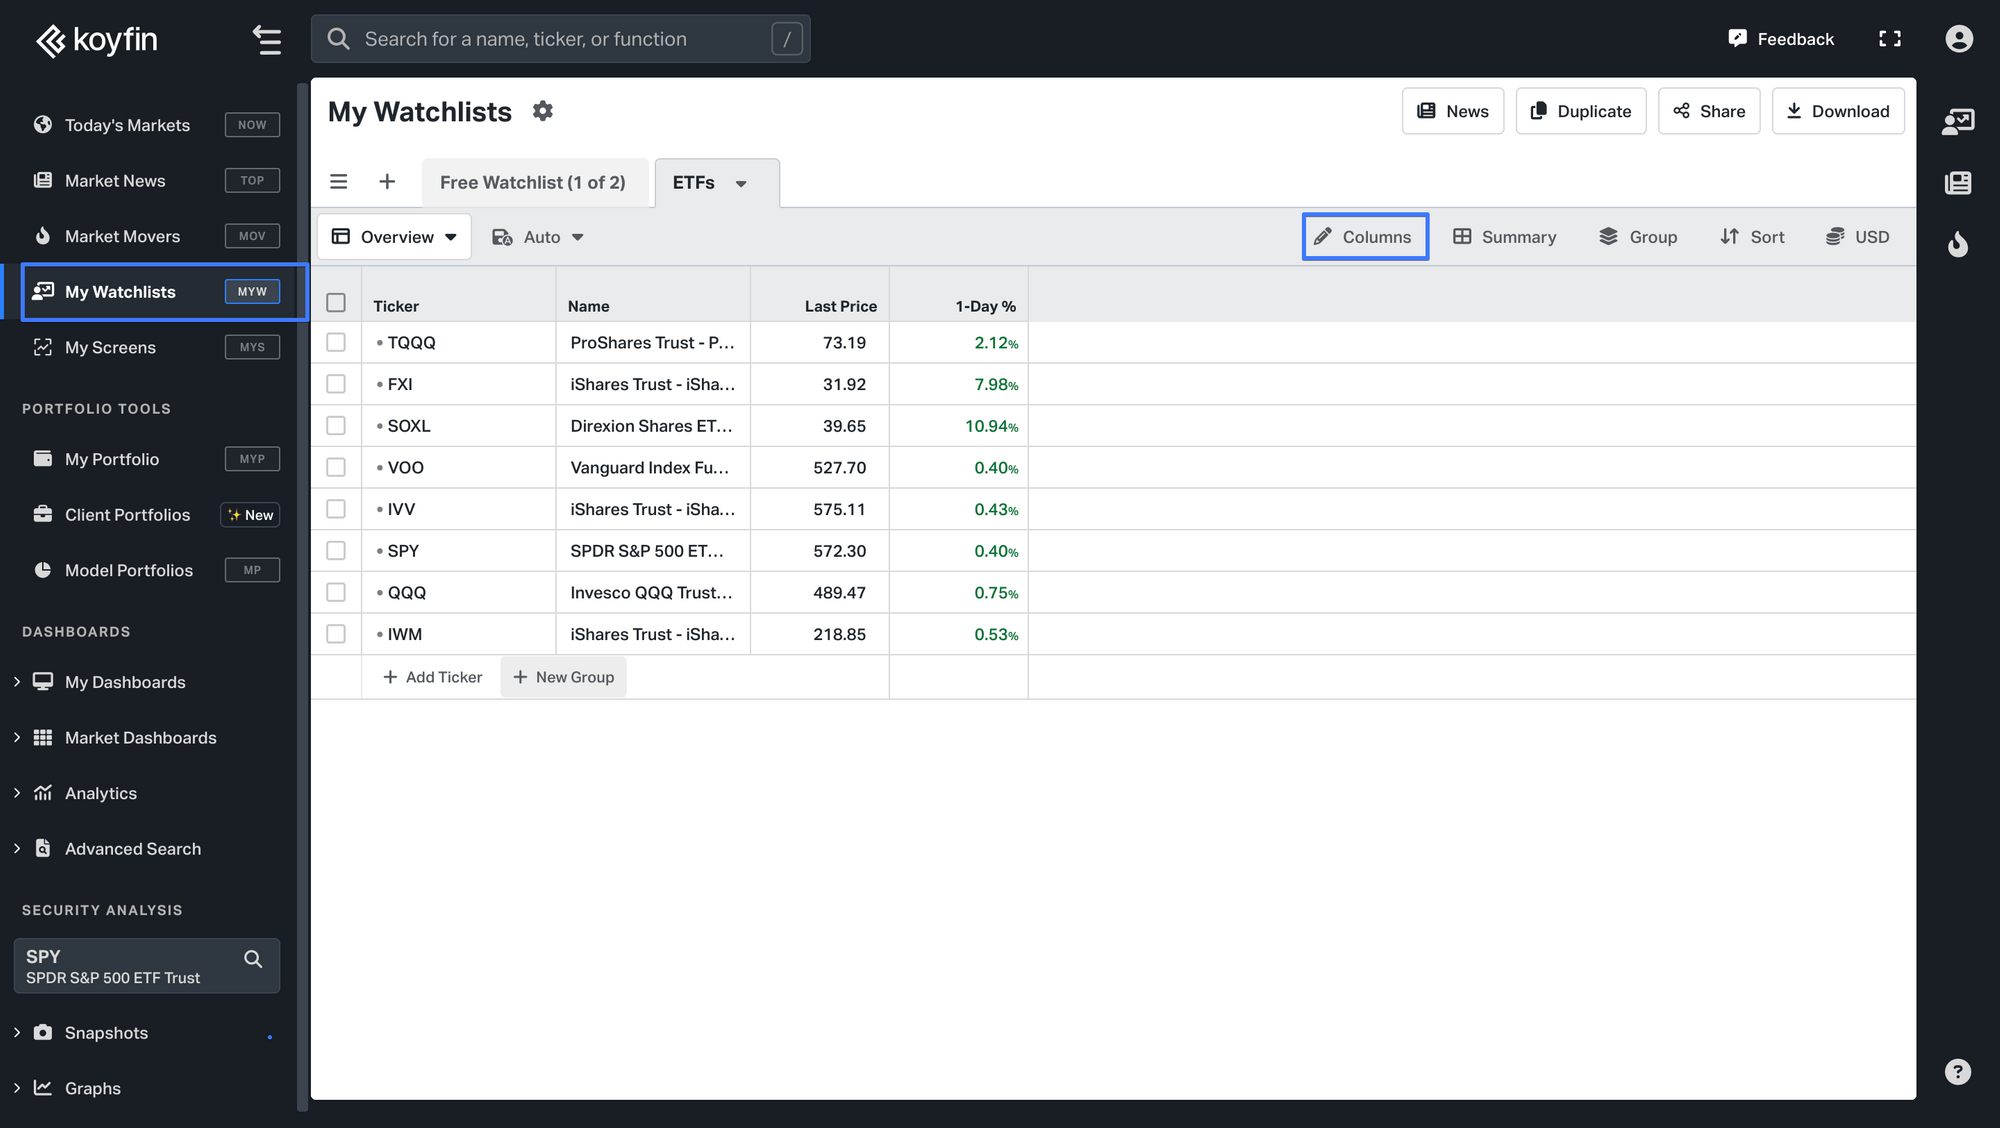
- Navigate to the left sidebar and click on My Watchlists.
- At the top of your watchlist, click on the Columns button.
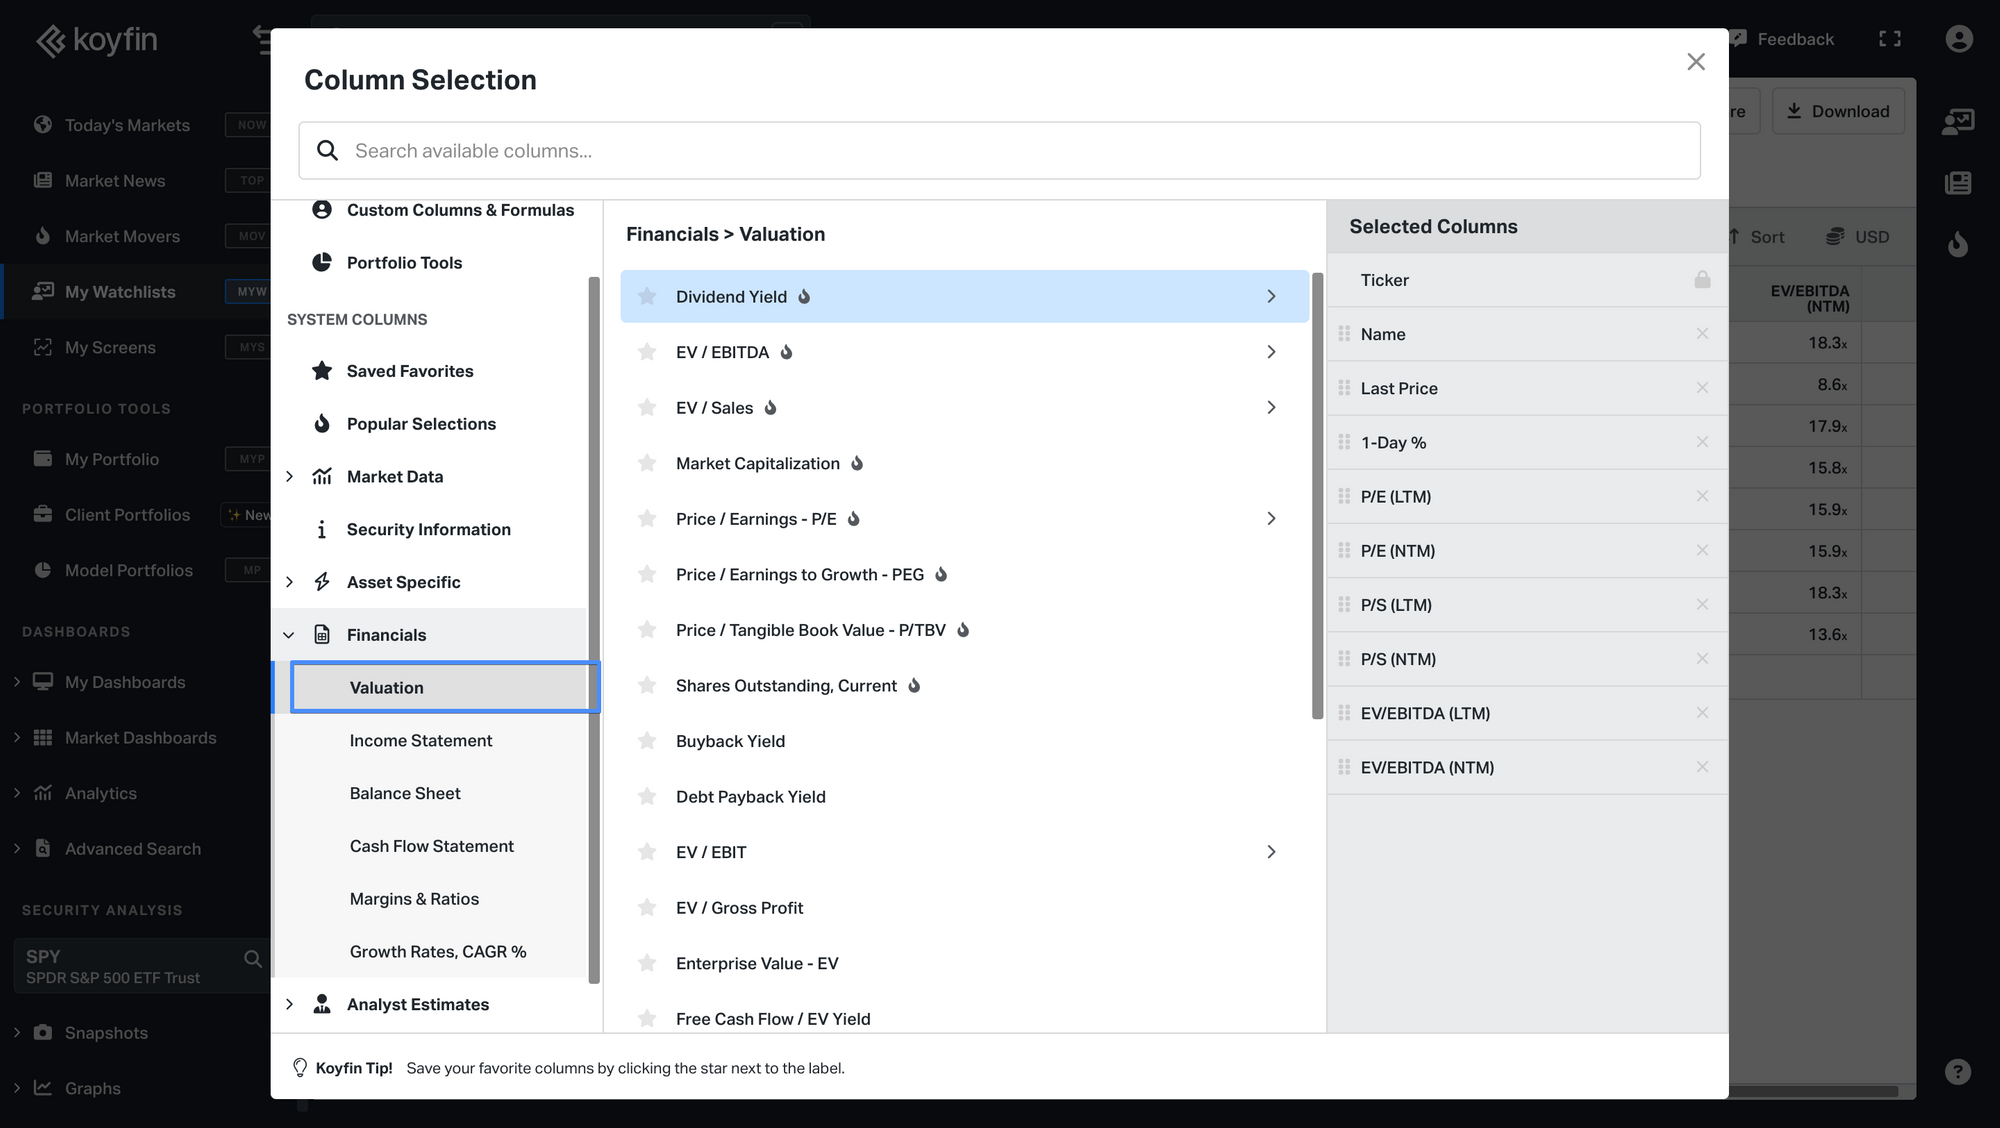
3. In the column selection menu, navigate to Financials and then select Valuation.
4. Select the valuation metrics you want to display, such as Price/Earnings, Price/Sales, or EV/EBITDA.
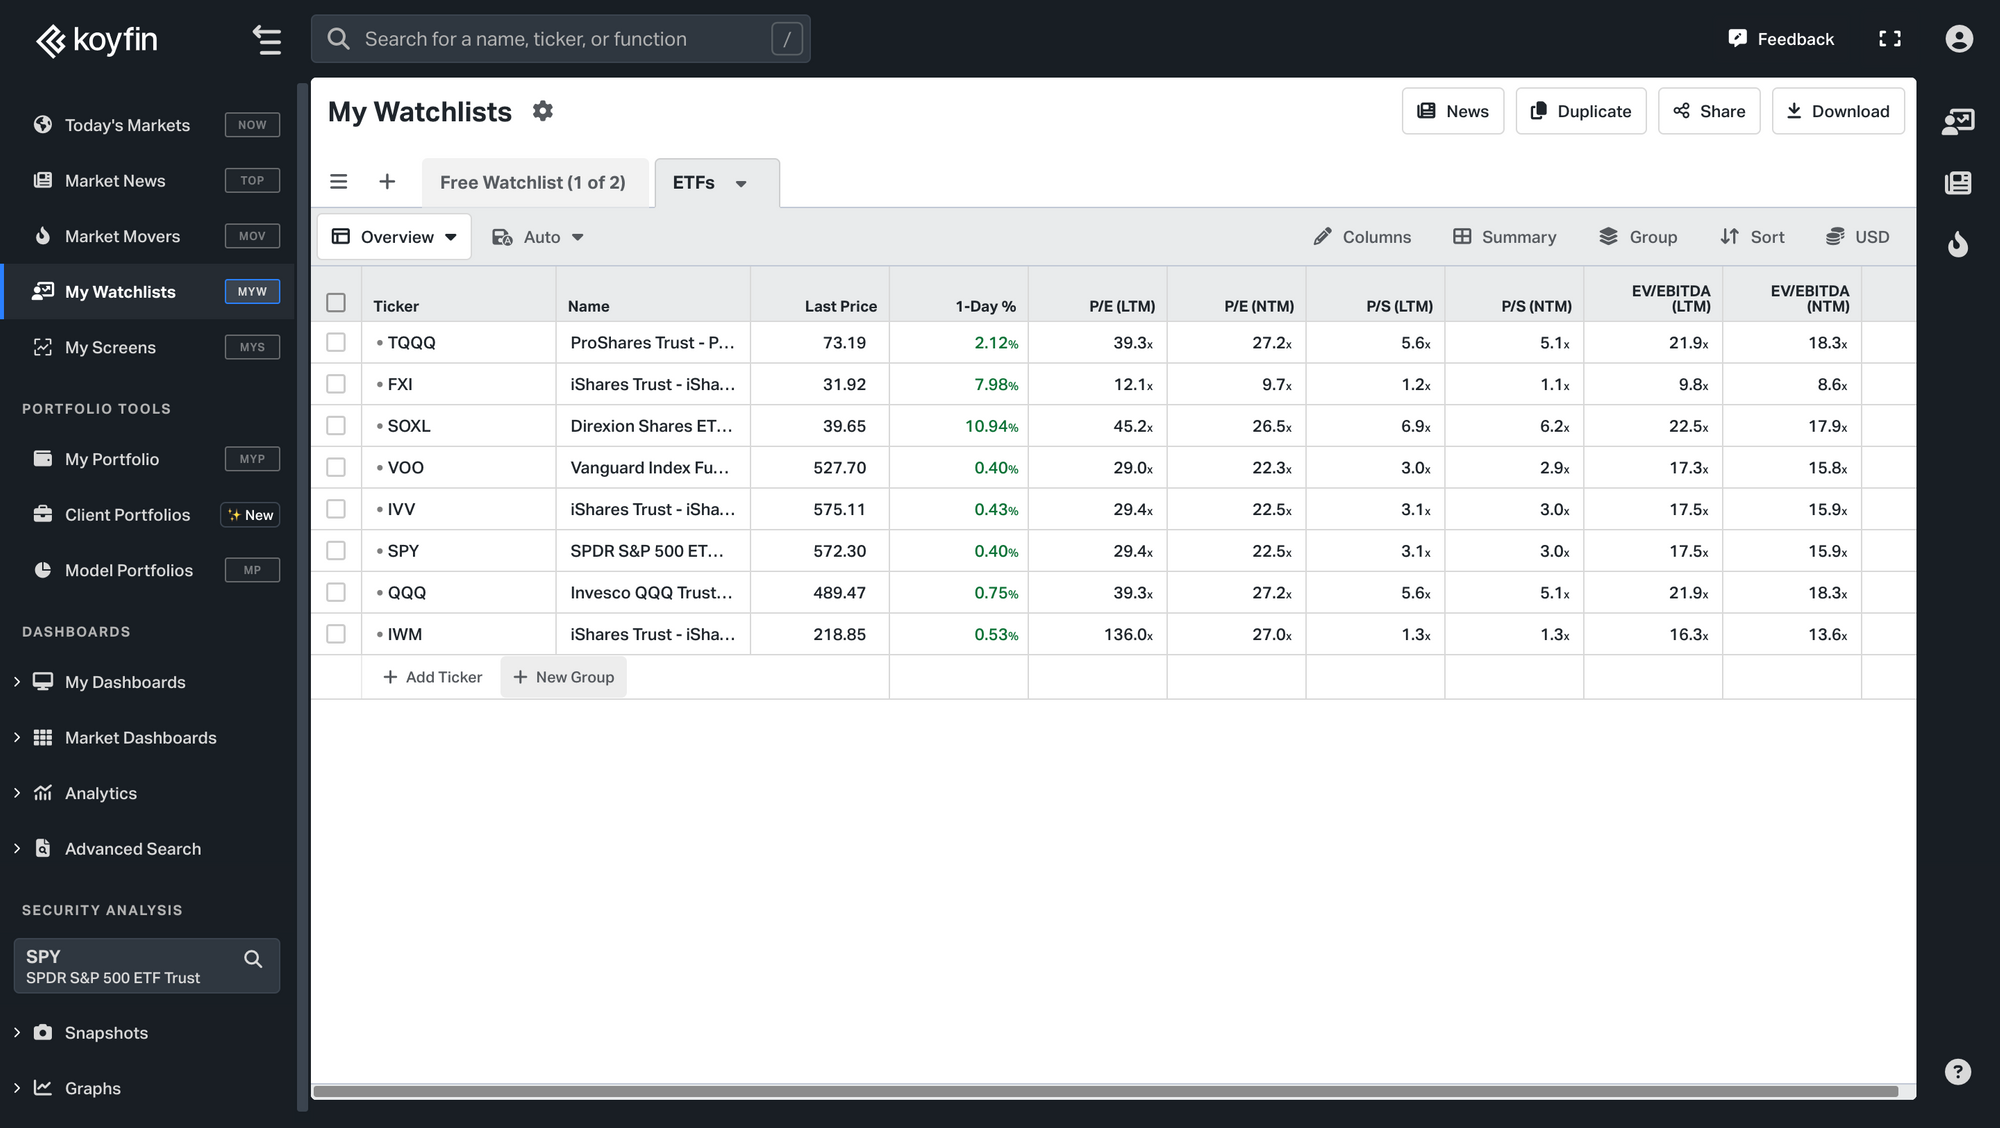
5. Close the column selection menu to view your watchlist with the new valuation metrics added.
My Screens
Creating custom screens with valuation multiples helps you find ETFs that meet specific investment criteria. To set up screens using valuation metrics, follow these steps:
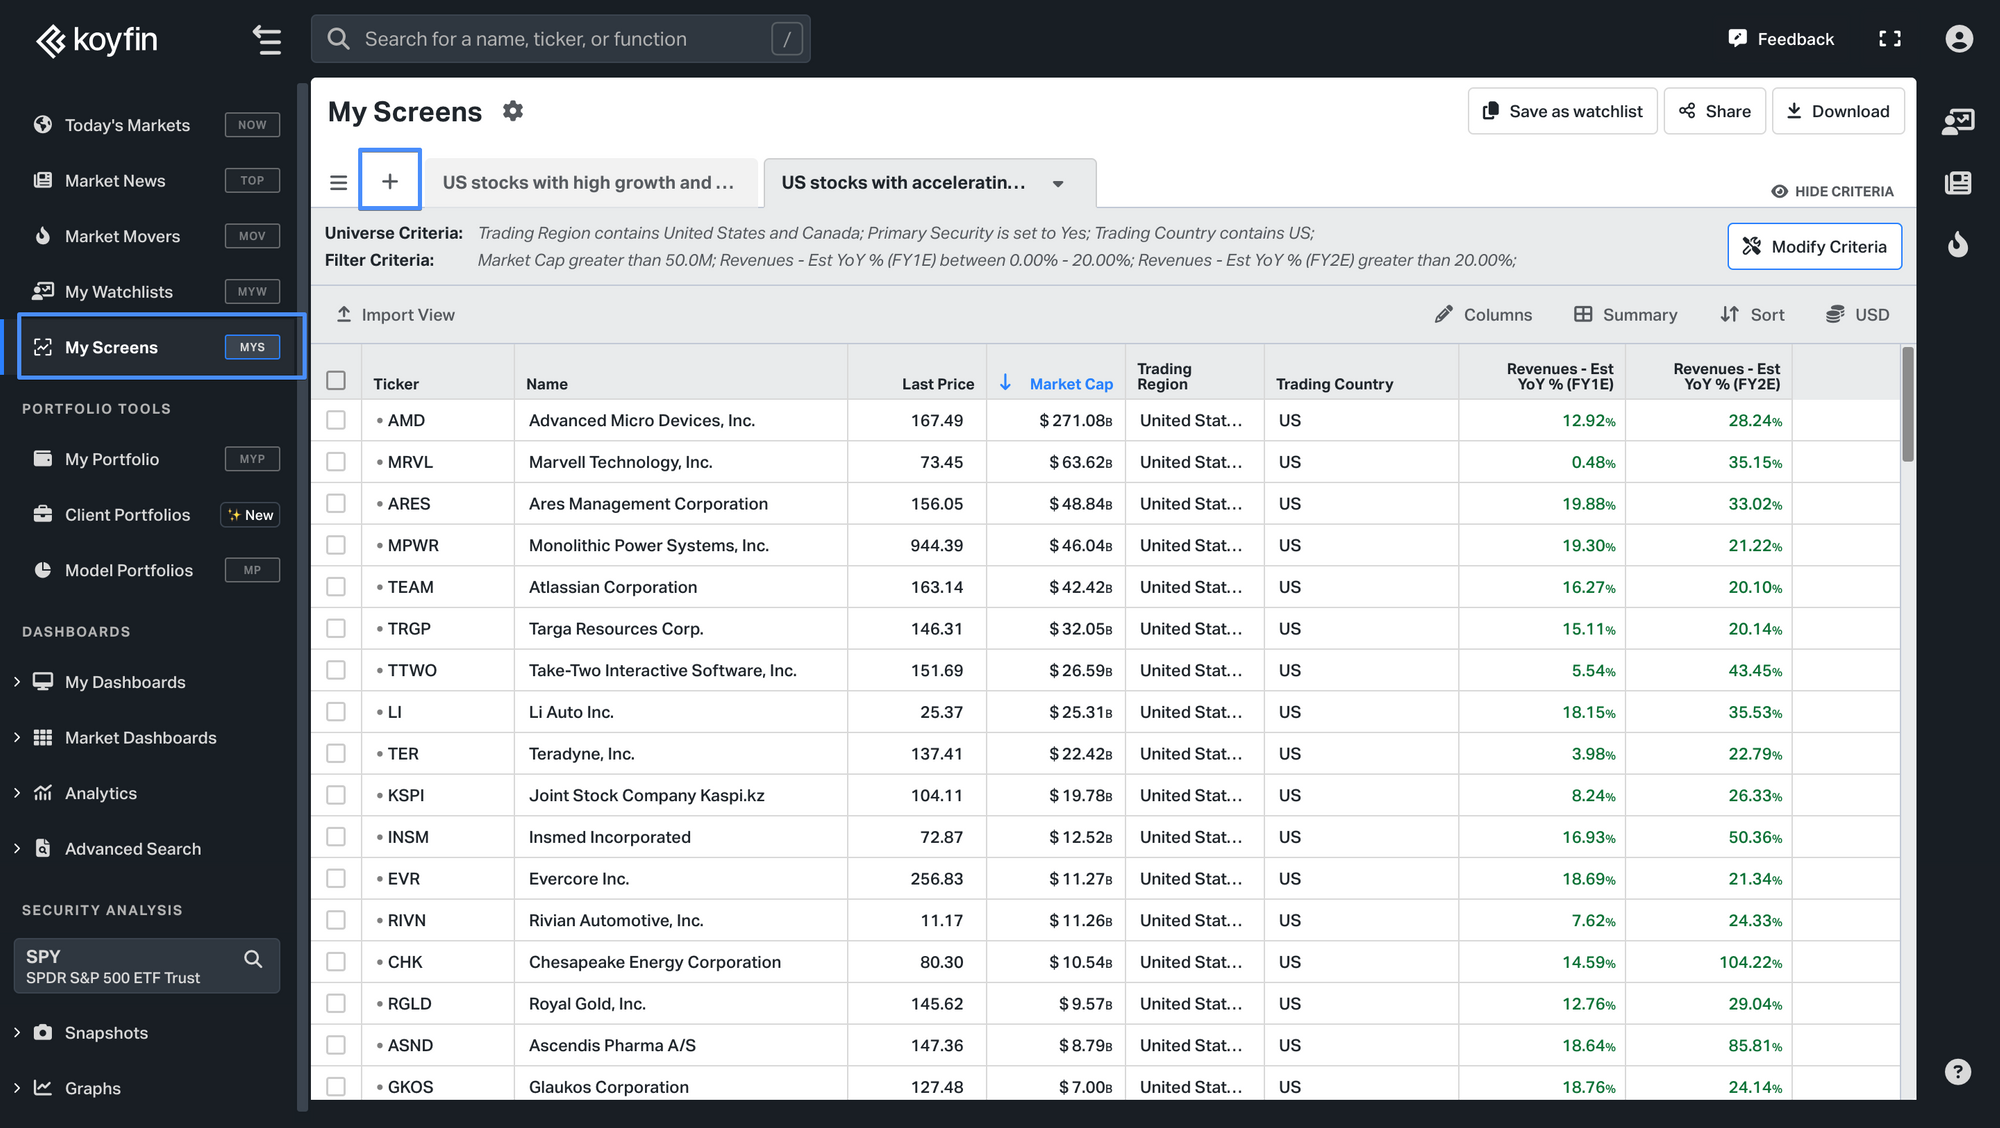
- To create a new screen, go to My Screens in the left sidebar, and click on the ➕ button at the top-left of the page.
2. Select the option to create a new screen from scratch.
3. Under Screen Type, choose ETFs.
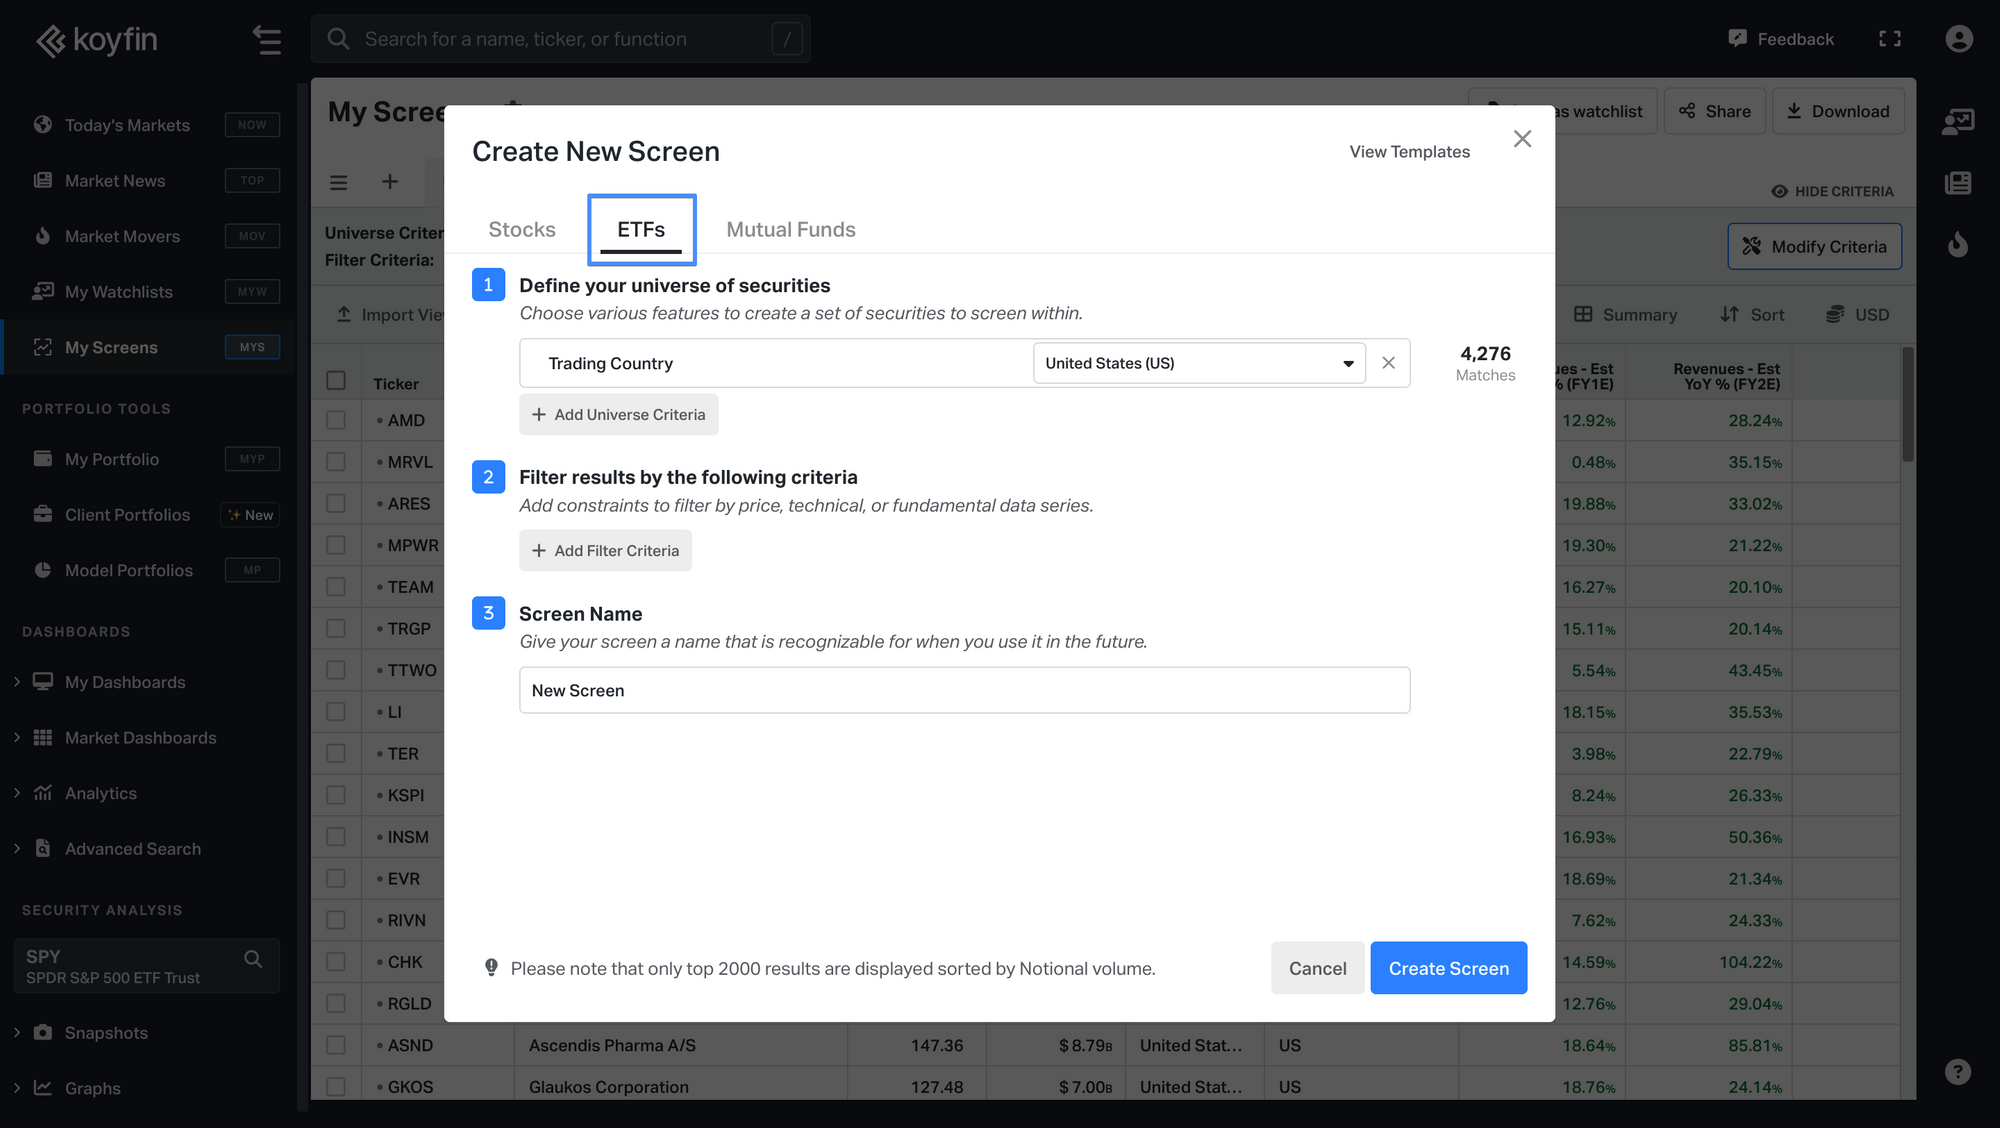
4. Choose the United States as the country.
Note: ETF valuations are available only for U.S. ETFs.
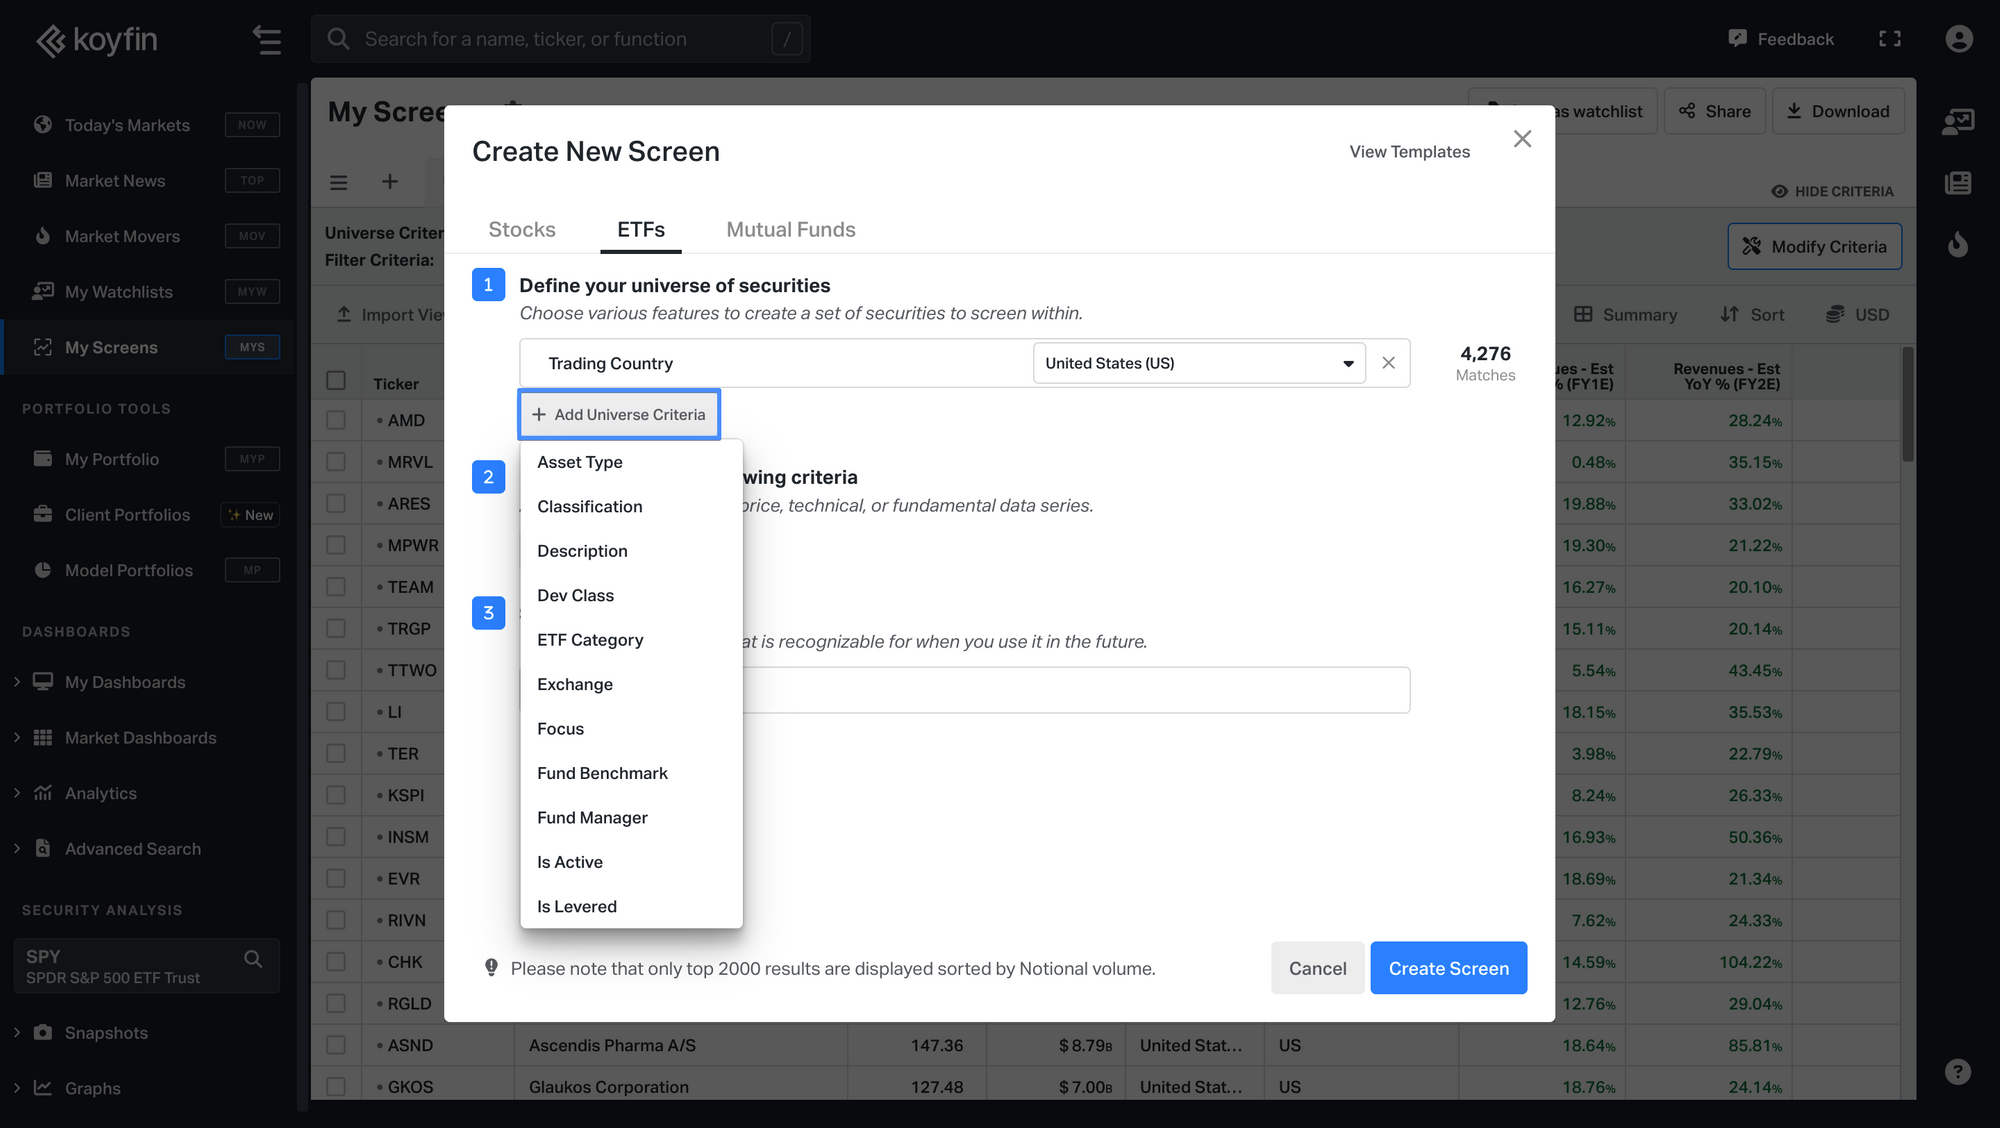
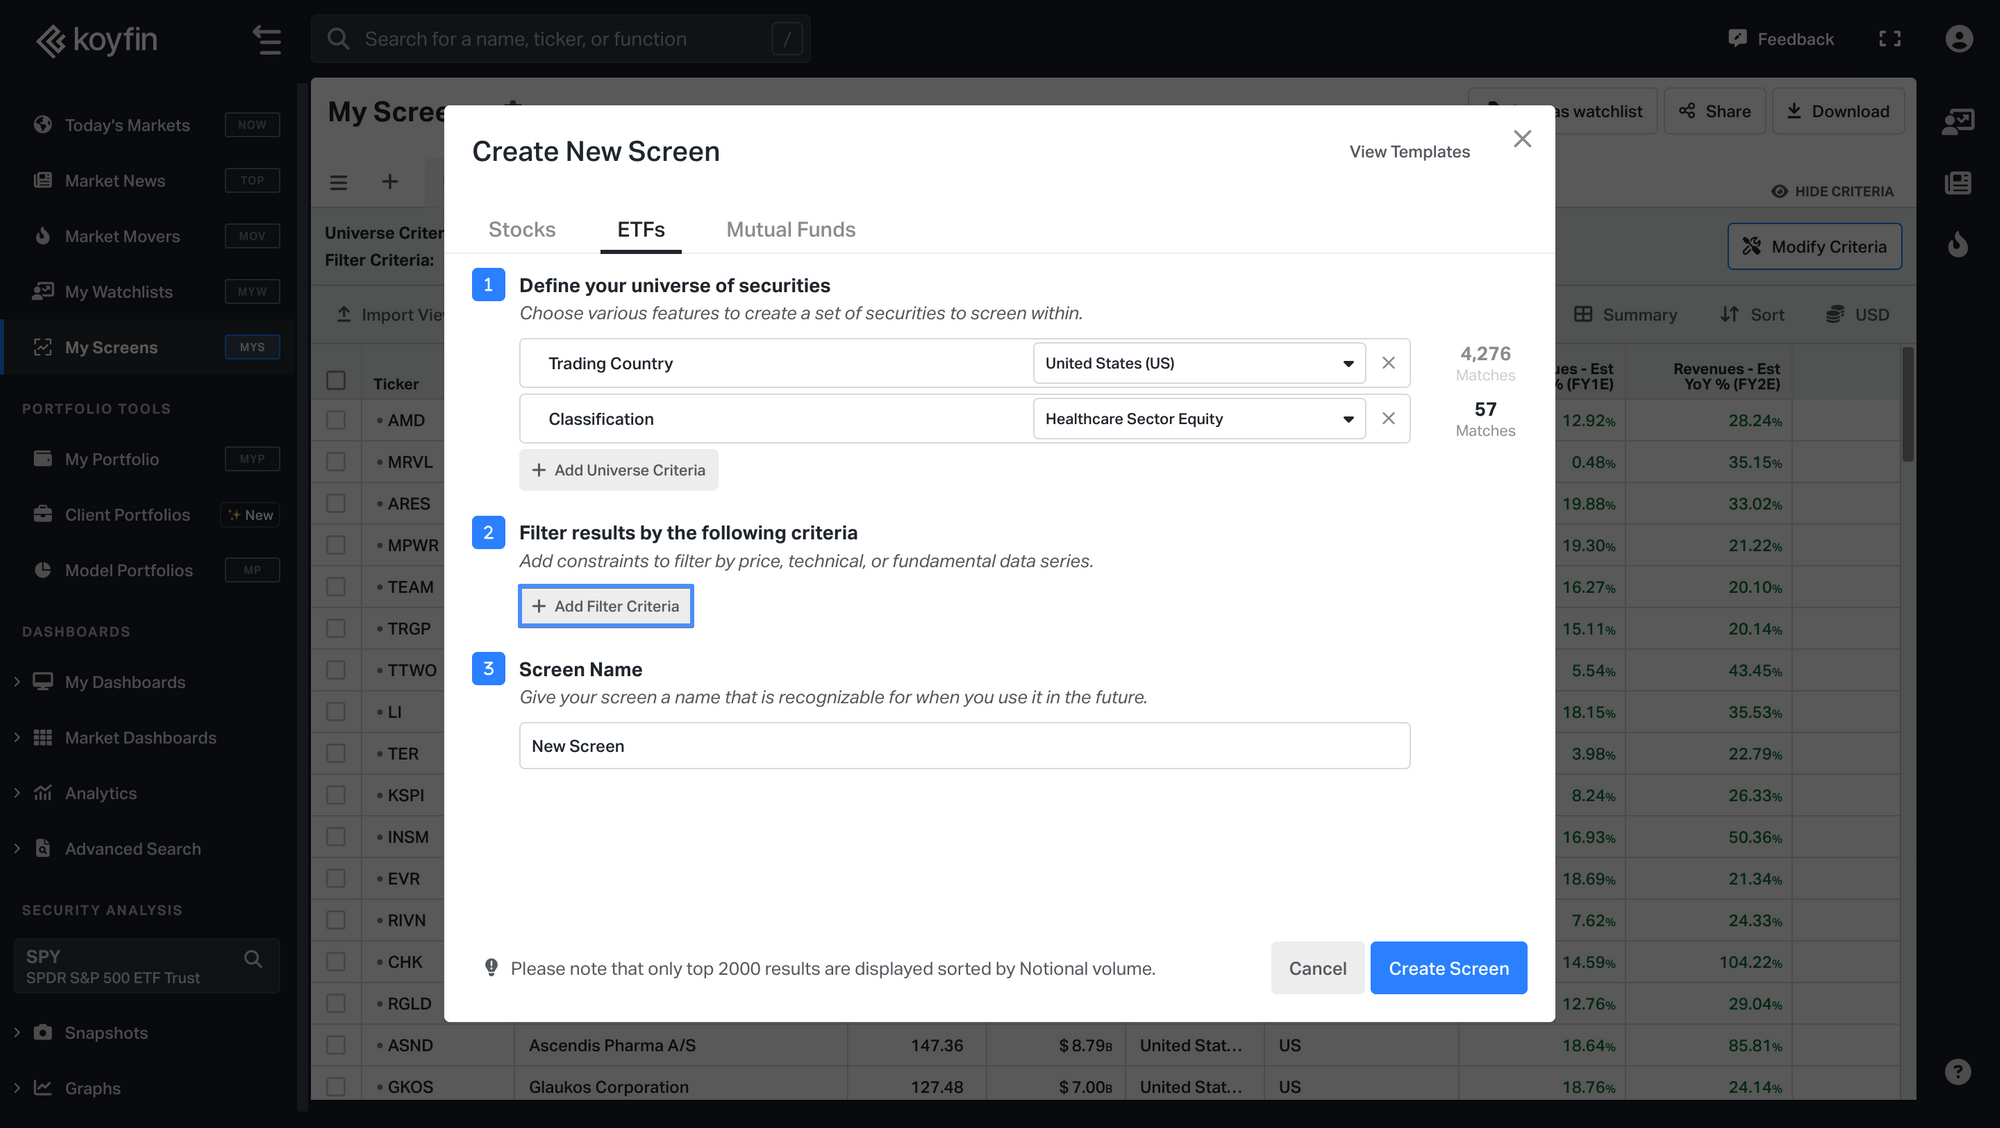
5. Use criteria like Asset Type, Classification, or Description to narrow down your universe.
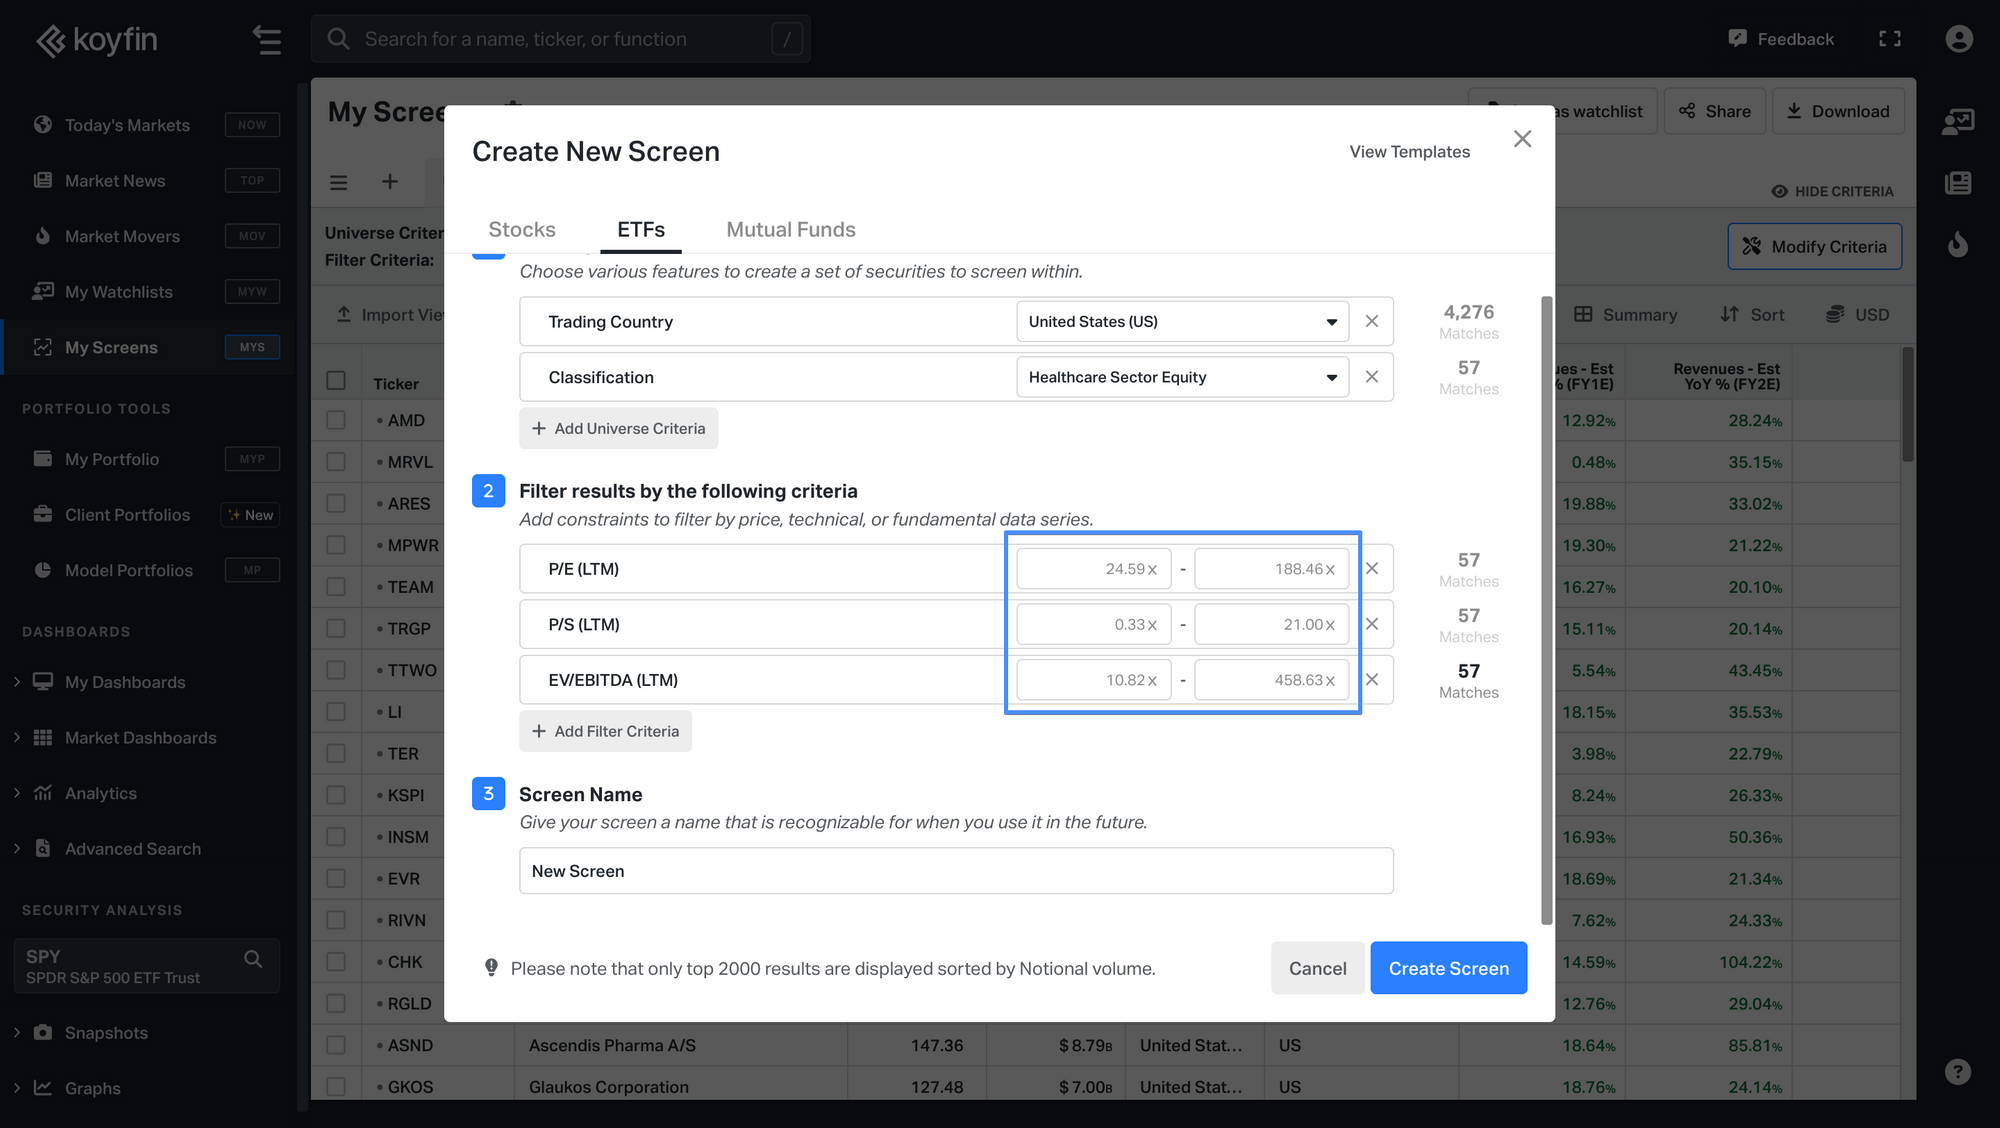
6. Click on Add Criteria and select valuation metrics such as Price/Earnings, Price/Sales, or EV/EBITDA.
7. Define the ranges or specific values for each metric to filter the results according to your preferences.
8. Enter a name for your screen to easily find and modify it later.
9. Once you've set all your criteria, click on Create Screen to generate your custom ETF screen.
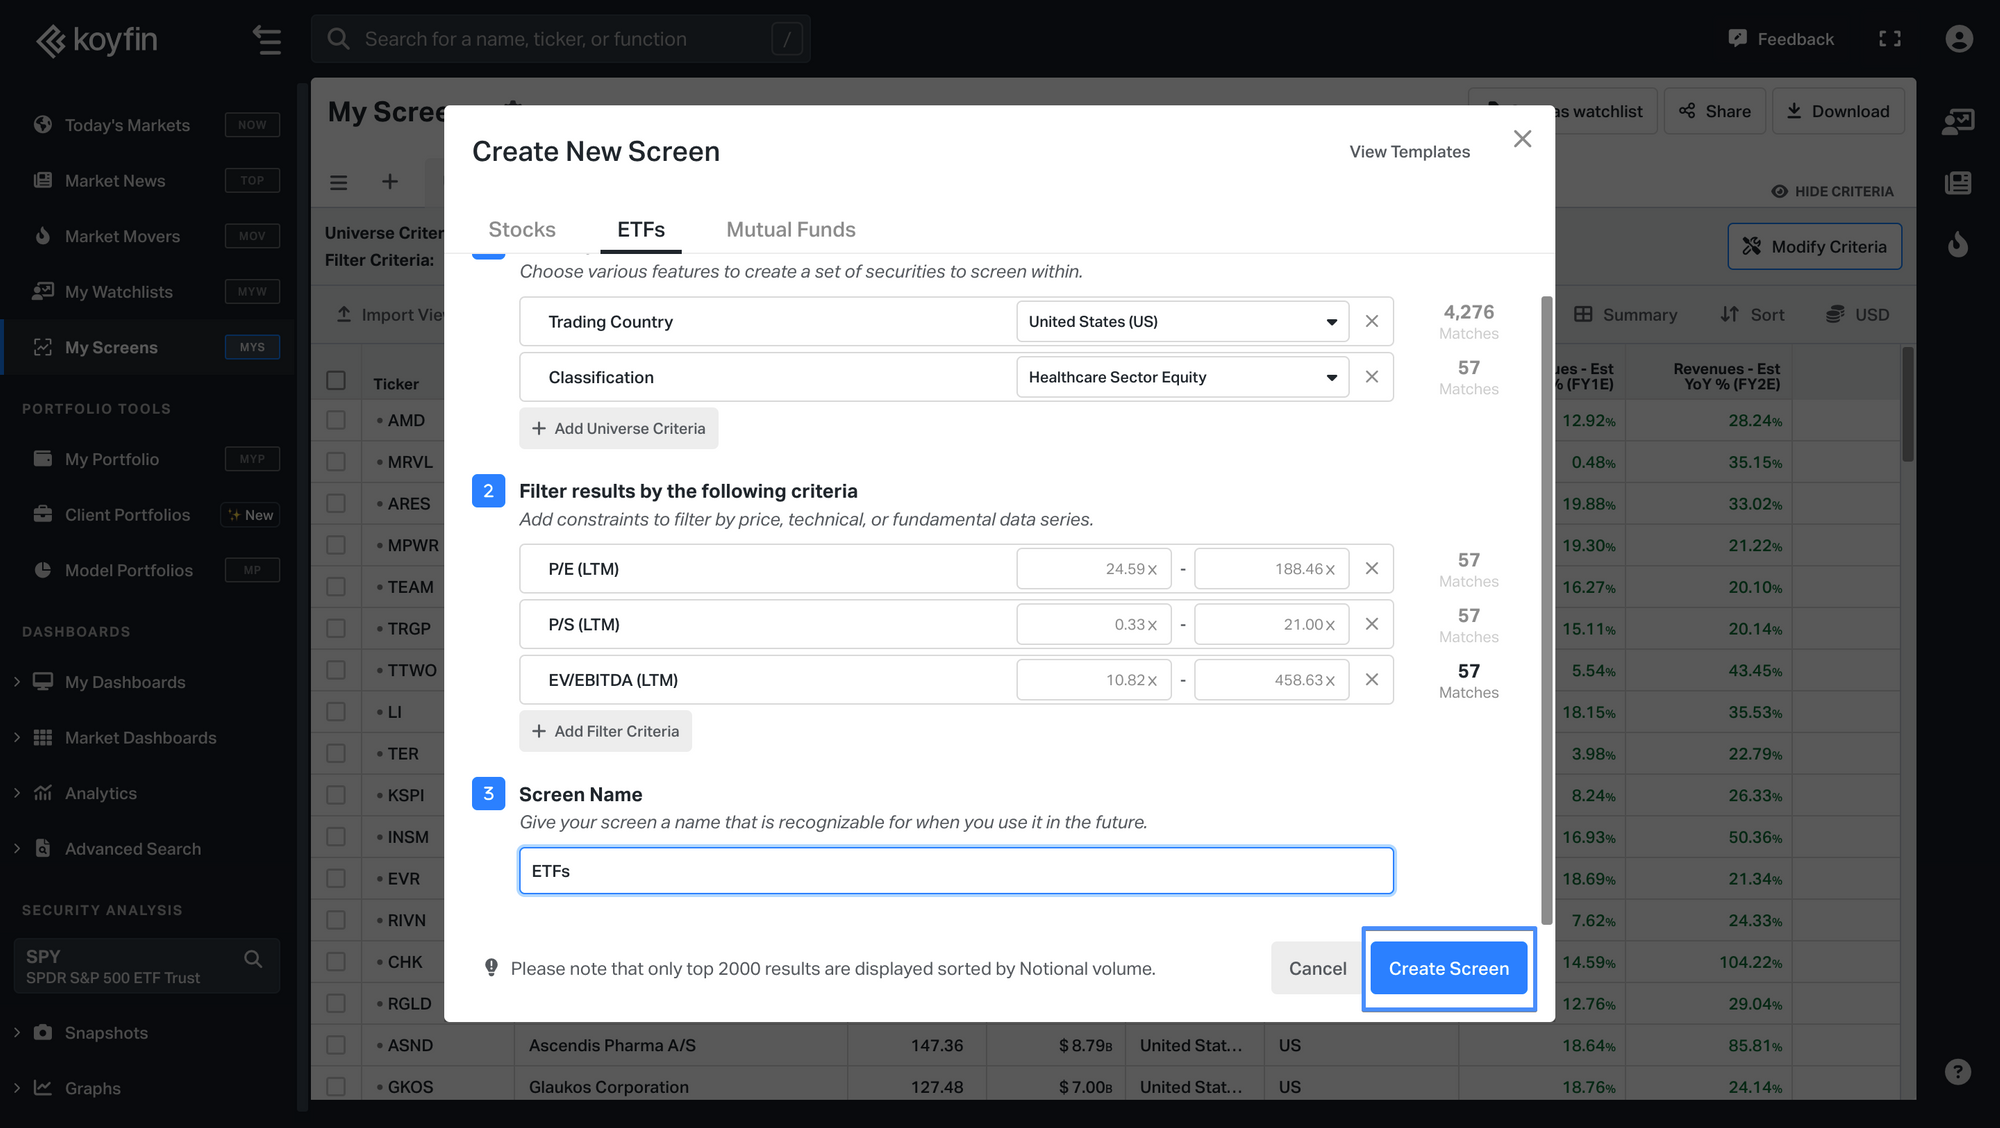
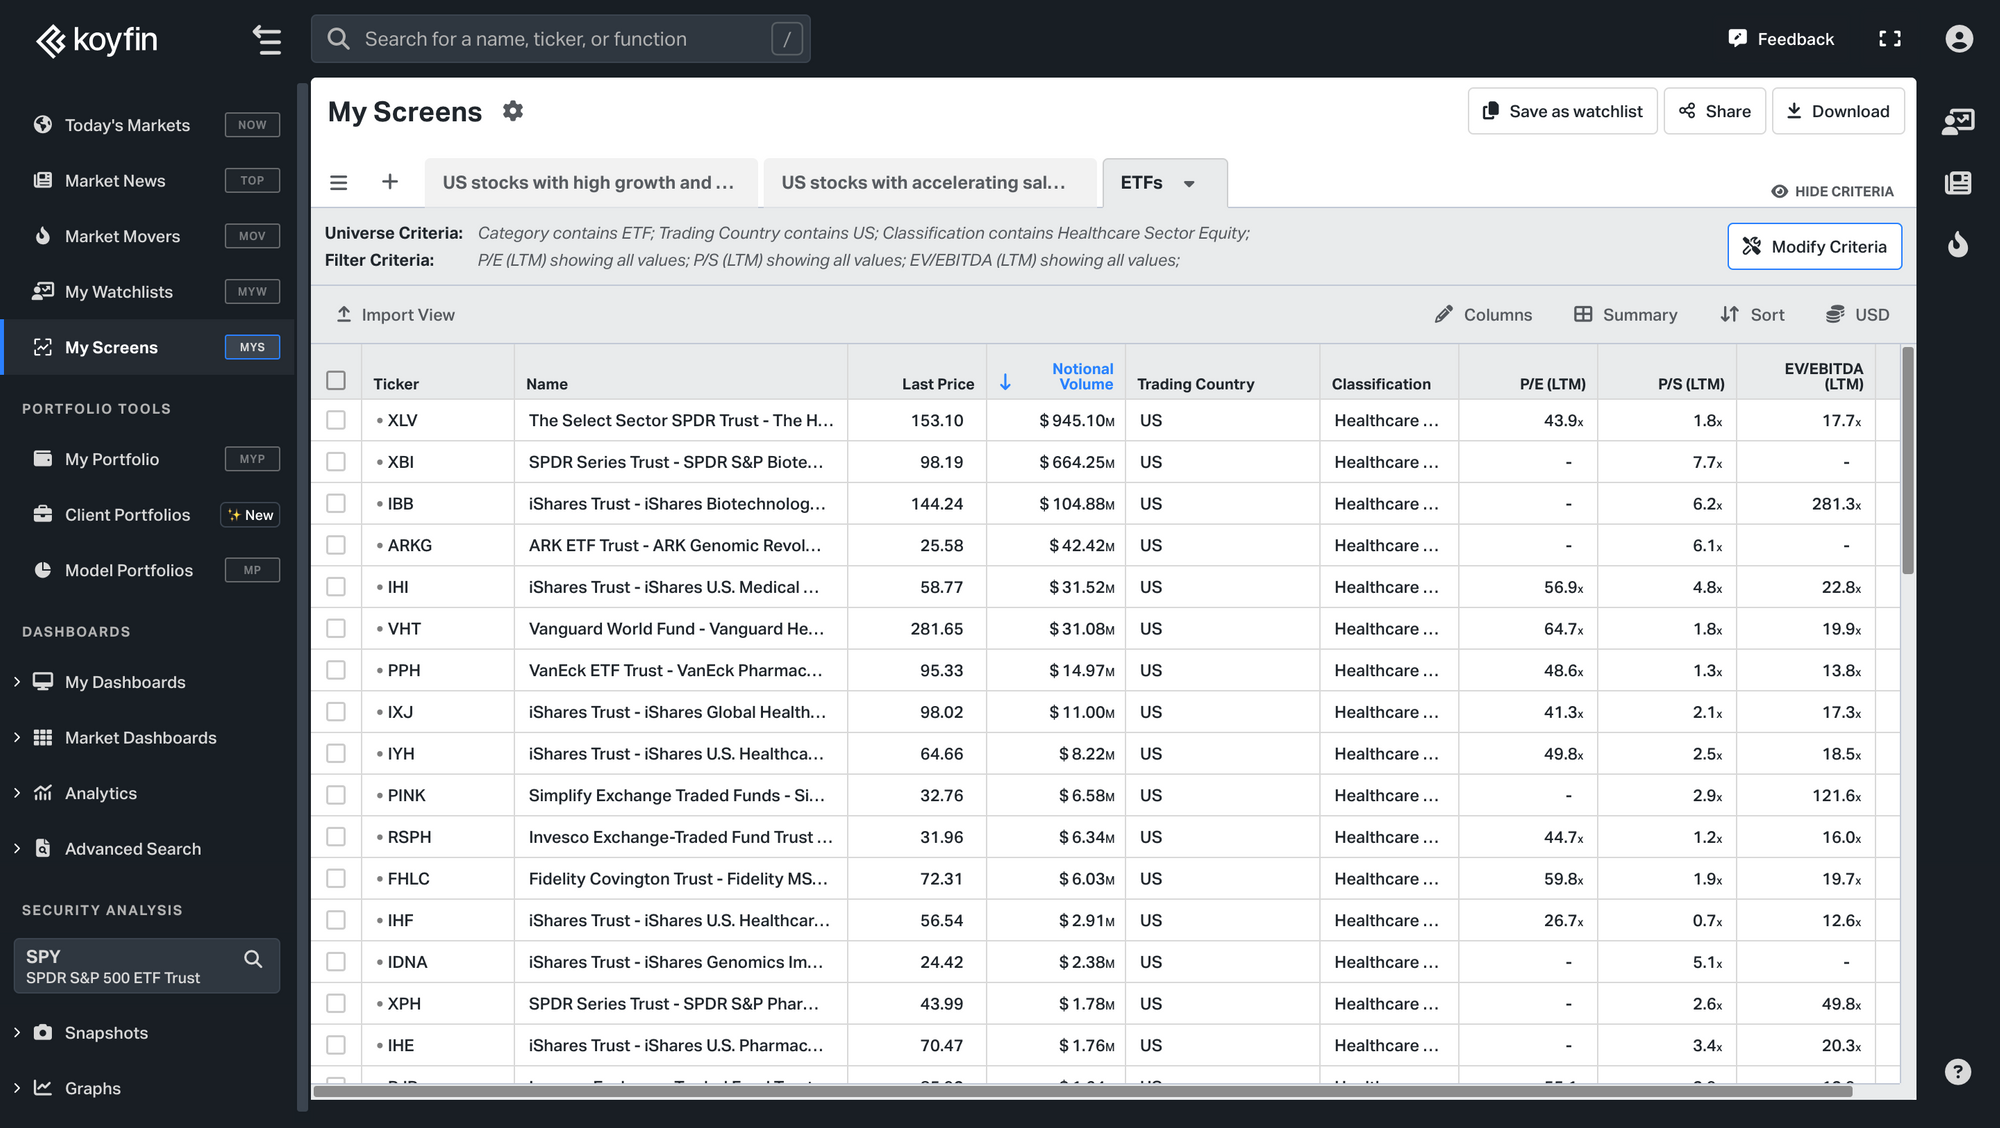
10. View the list of ETFs that meet your specified criteria and valuation metrics.
ETF Valuation Graphs on Mobile
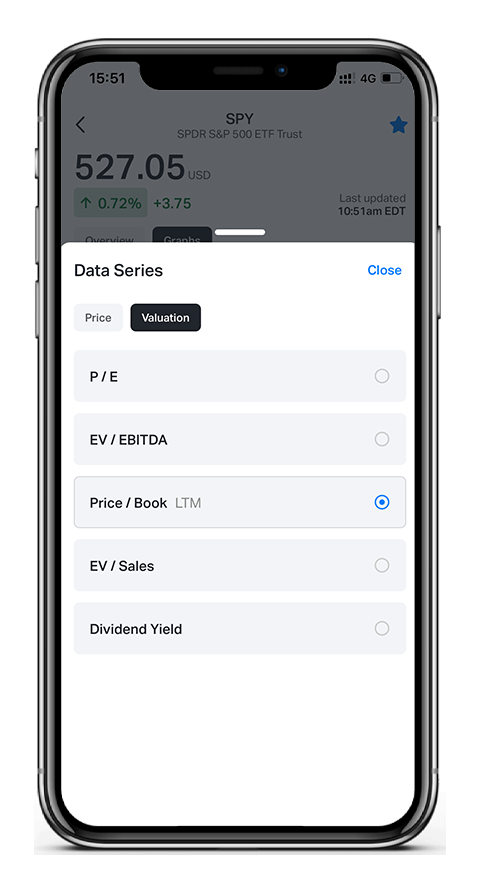
Koyfin's mobile app allows you to access valuation graphs on the go. This functionality ensures you can monitor and analyze ETF valuations anytime and anywhere, keeping you informed for timely investment decisions.
- Open the Koyfin app on your mobile device and use the search bar to find the ETF you're interested in.
- Navigate to the ETF's chart to view valuation metrics. You can select data such as Price/Earnings, Price/Sales, or Price/ Book directly from your phone.
Calculating ETF Valuation Multiples Using the Harmonic Average
We calculate ETFs P/E and several other ratios using a harmonic weighted average to minimize the impact of outliers. We use market capitalization, earnings estimates, and portfolio weights for each stock in the ETF. We normalize the weights so they sum to 100%, then compute each stock's Earnings-to-Price (E/P) ratio by dividing estimated earnings by the current stock price, capping these ratios at a maximum of 1 to prevent skewing. We calculate a weighted average of the capped E/P ratios using the normalized weights, and the reciprocal of this average gives us the ETF's overall P/E ratio based on next twelve months (NTM) earnings estimates. To ensure accuracy, we adjust the ETF constituents daily to reflect any changes and use the most recent market data.