Koyfin allows users to create custom baskets of securities and track their performance using various features such as model portfolios, watchlists, and lots of charts.
This guide will show you how to create custom indices and utilize powerful tools to manage and analyze these assets.
1. Create a Model Portfolio
To create your custom index of securities, use the model portfolio feature. Here's how you can set up one:
1. Open Model Portfolios feature.
For an in-depth guide on Model Portfolios, check out this exciting article on the feature.
2. Click on 'Create New' and name your model portfolio.

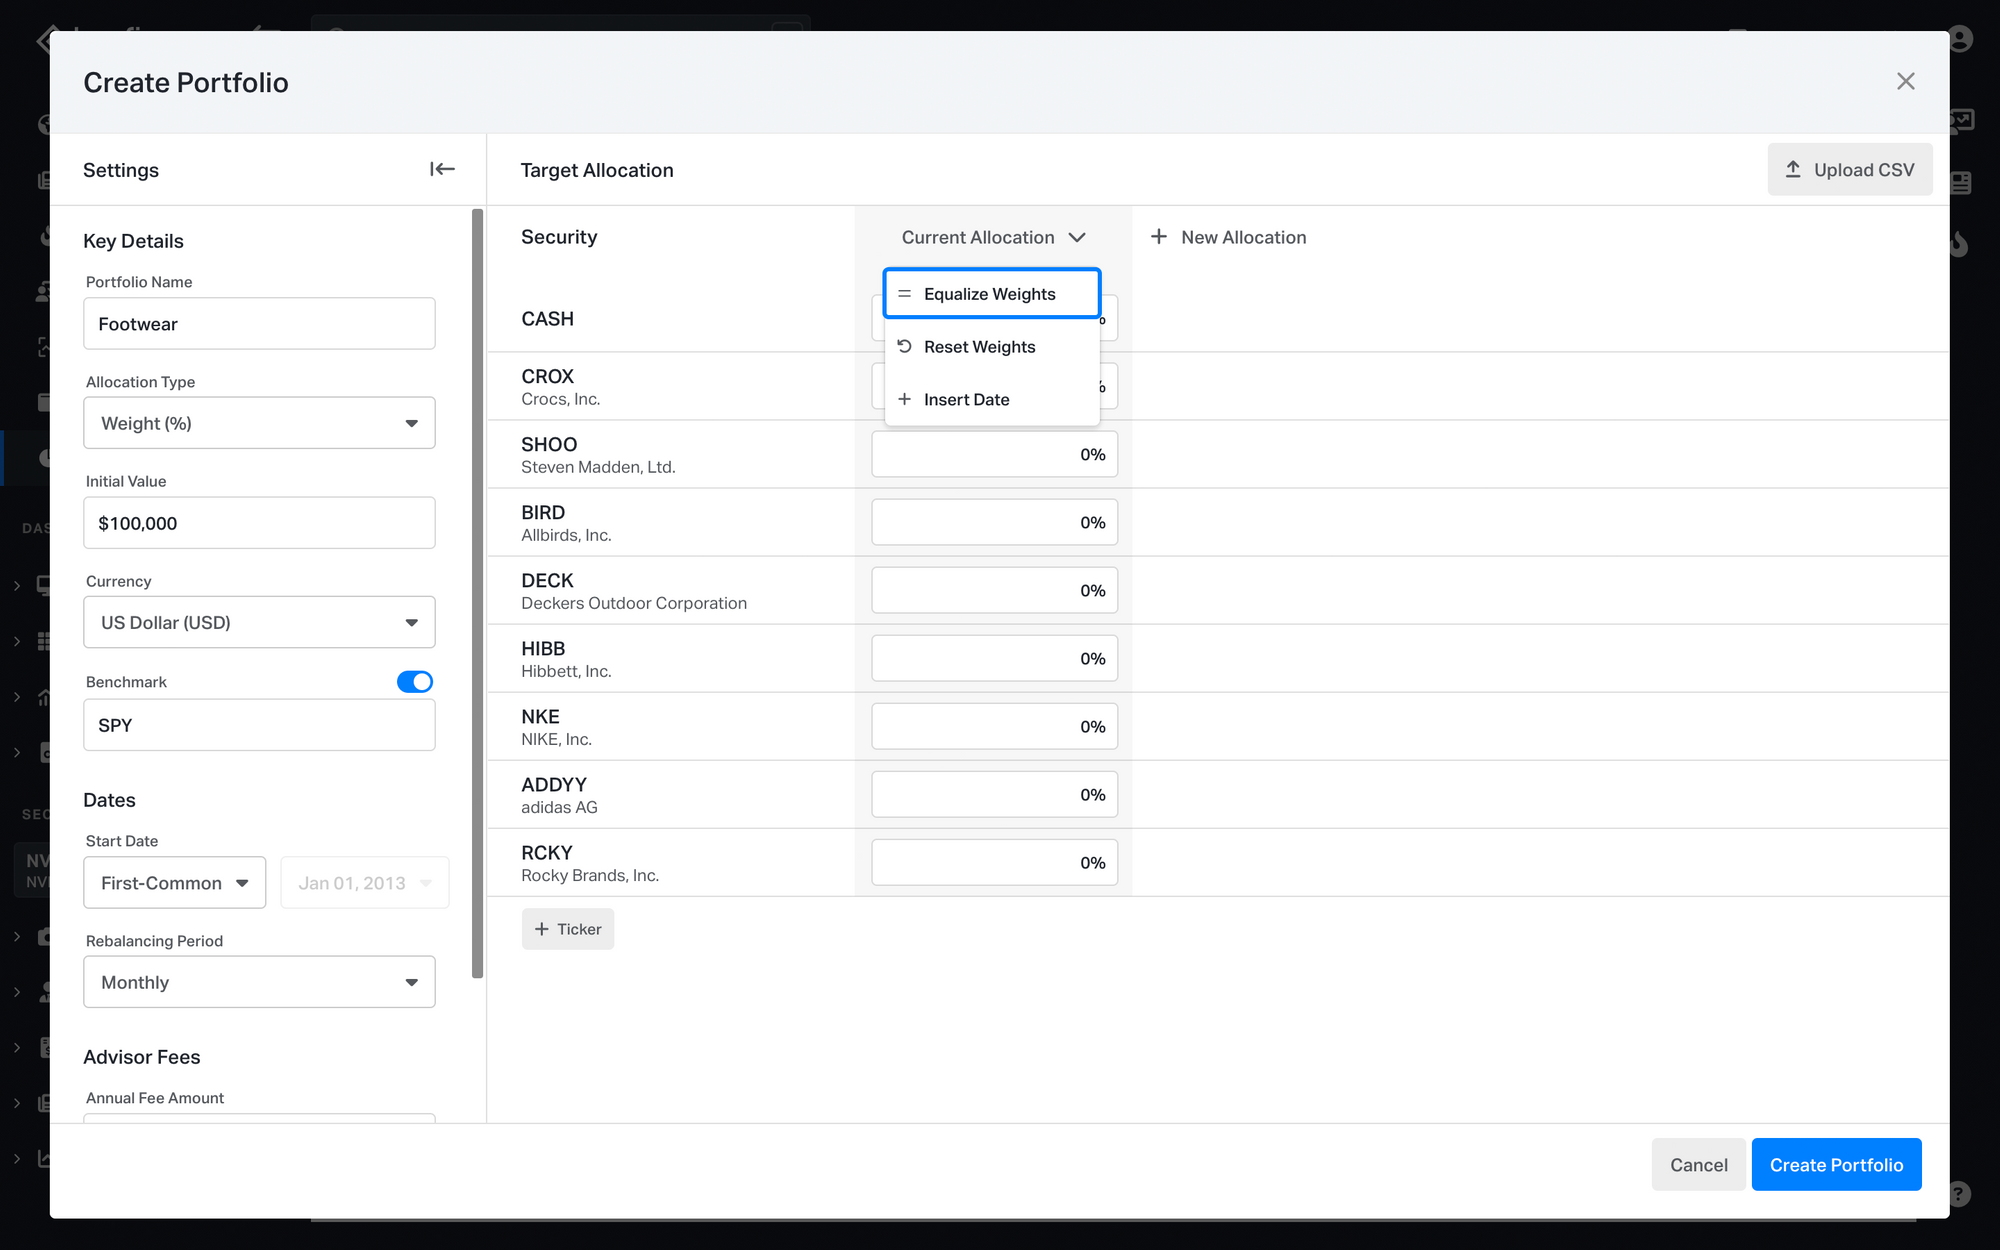
3. Choose the stocks in the custom index. You can manually input companies based on your criteria. For example, let's create a custom index with footwear companies: CROX, SHOO, BIRD, DECK, HIBB, NKE, ADDYY, and RCKY.
4. Decide how to allocate weights among the selected securities. You can equal-weight the securities by clicking on the dropdown near “Current Allocation.”
5. Choose a rebalancing period. For our example, we will choose the annual rebalancing period. That means the custom index will be rebalanced to the desired weights every year.
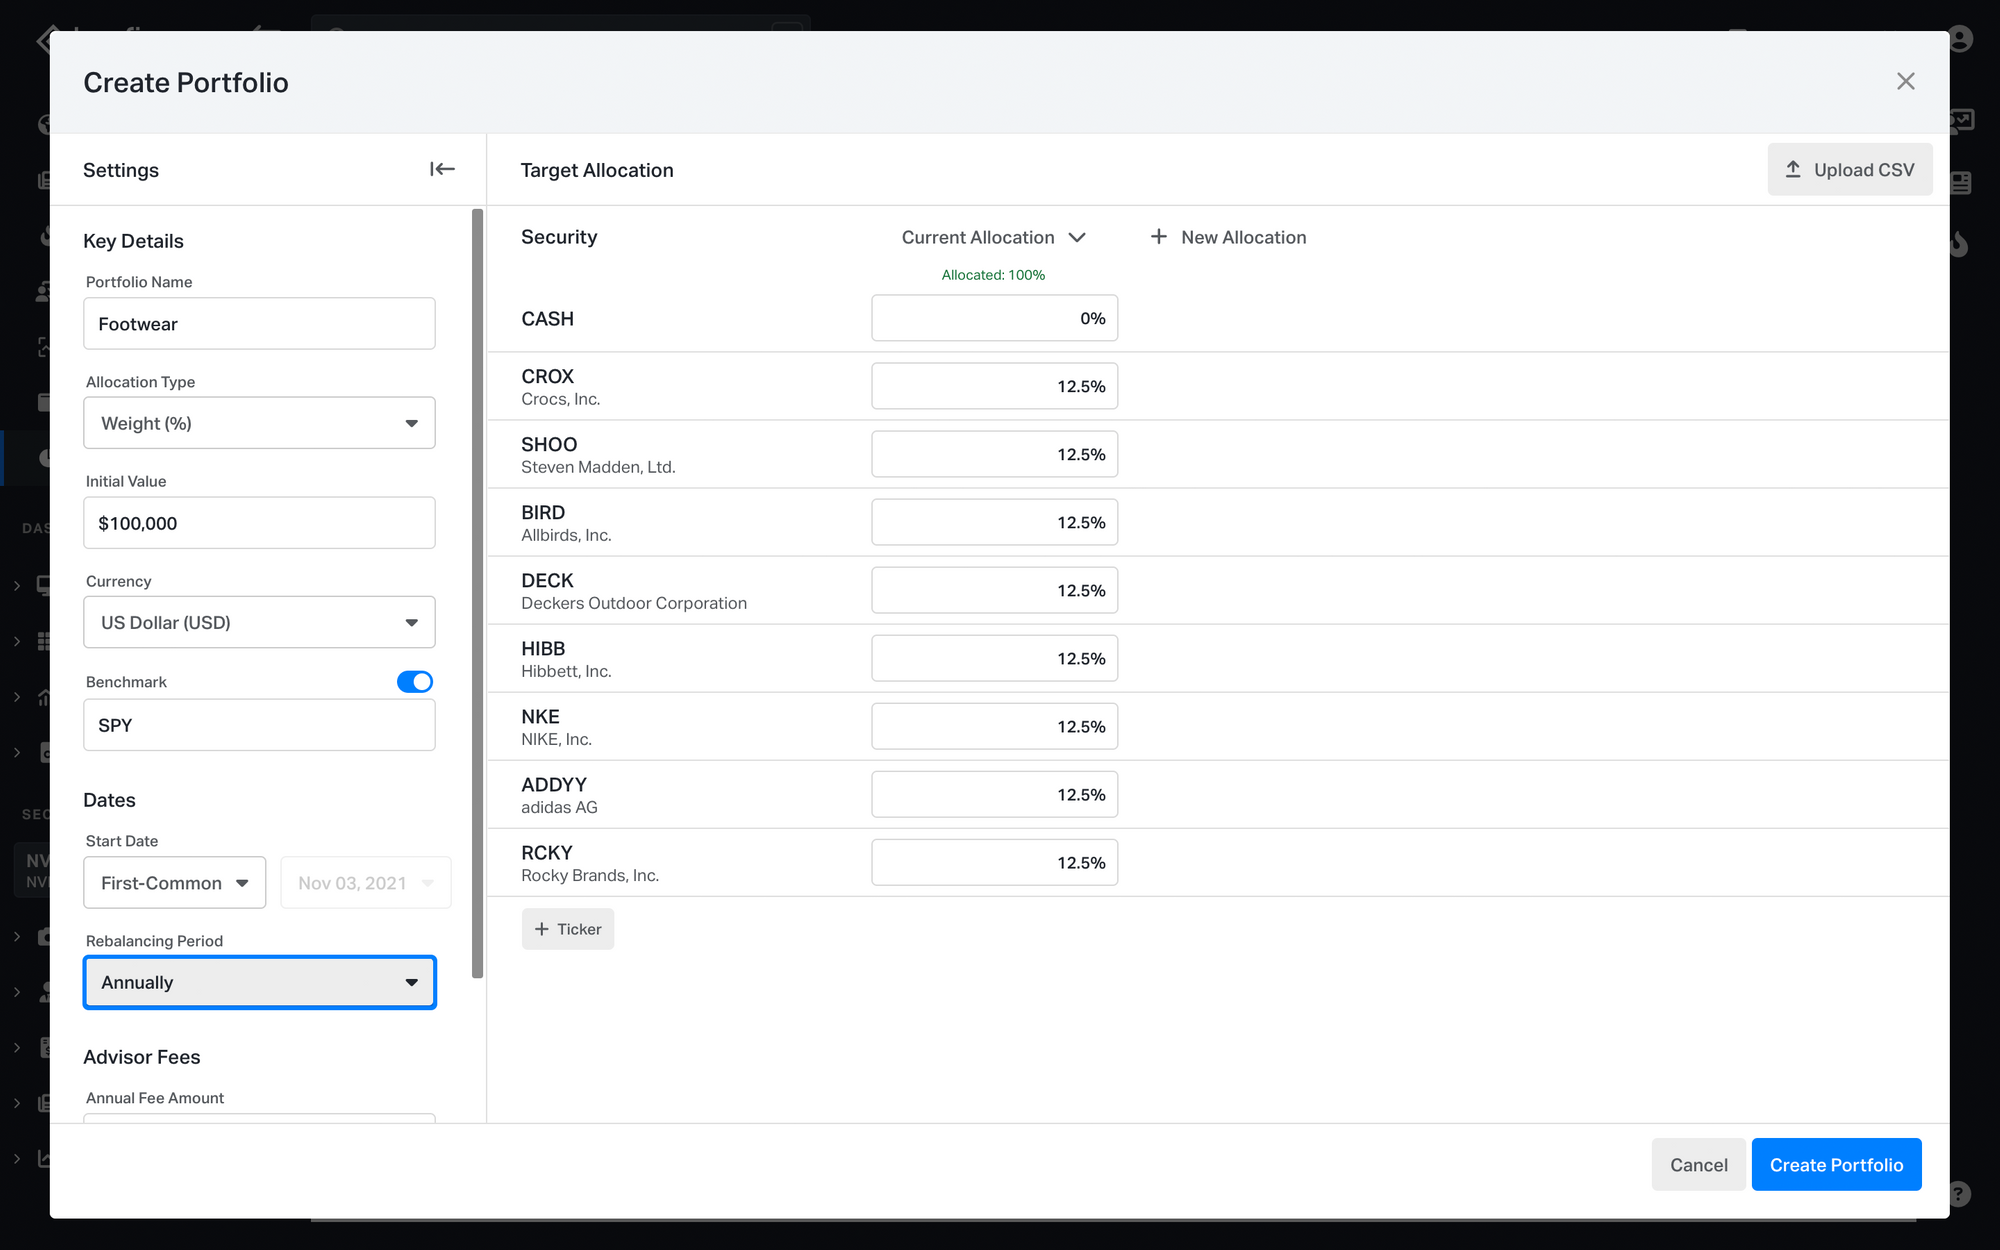
6. If you don't want fees, set the collection period to none. Set the start date of the index to the first common date when all the stocks were trading.
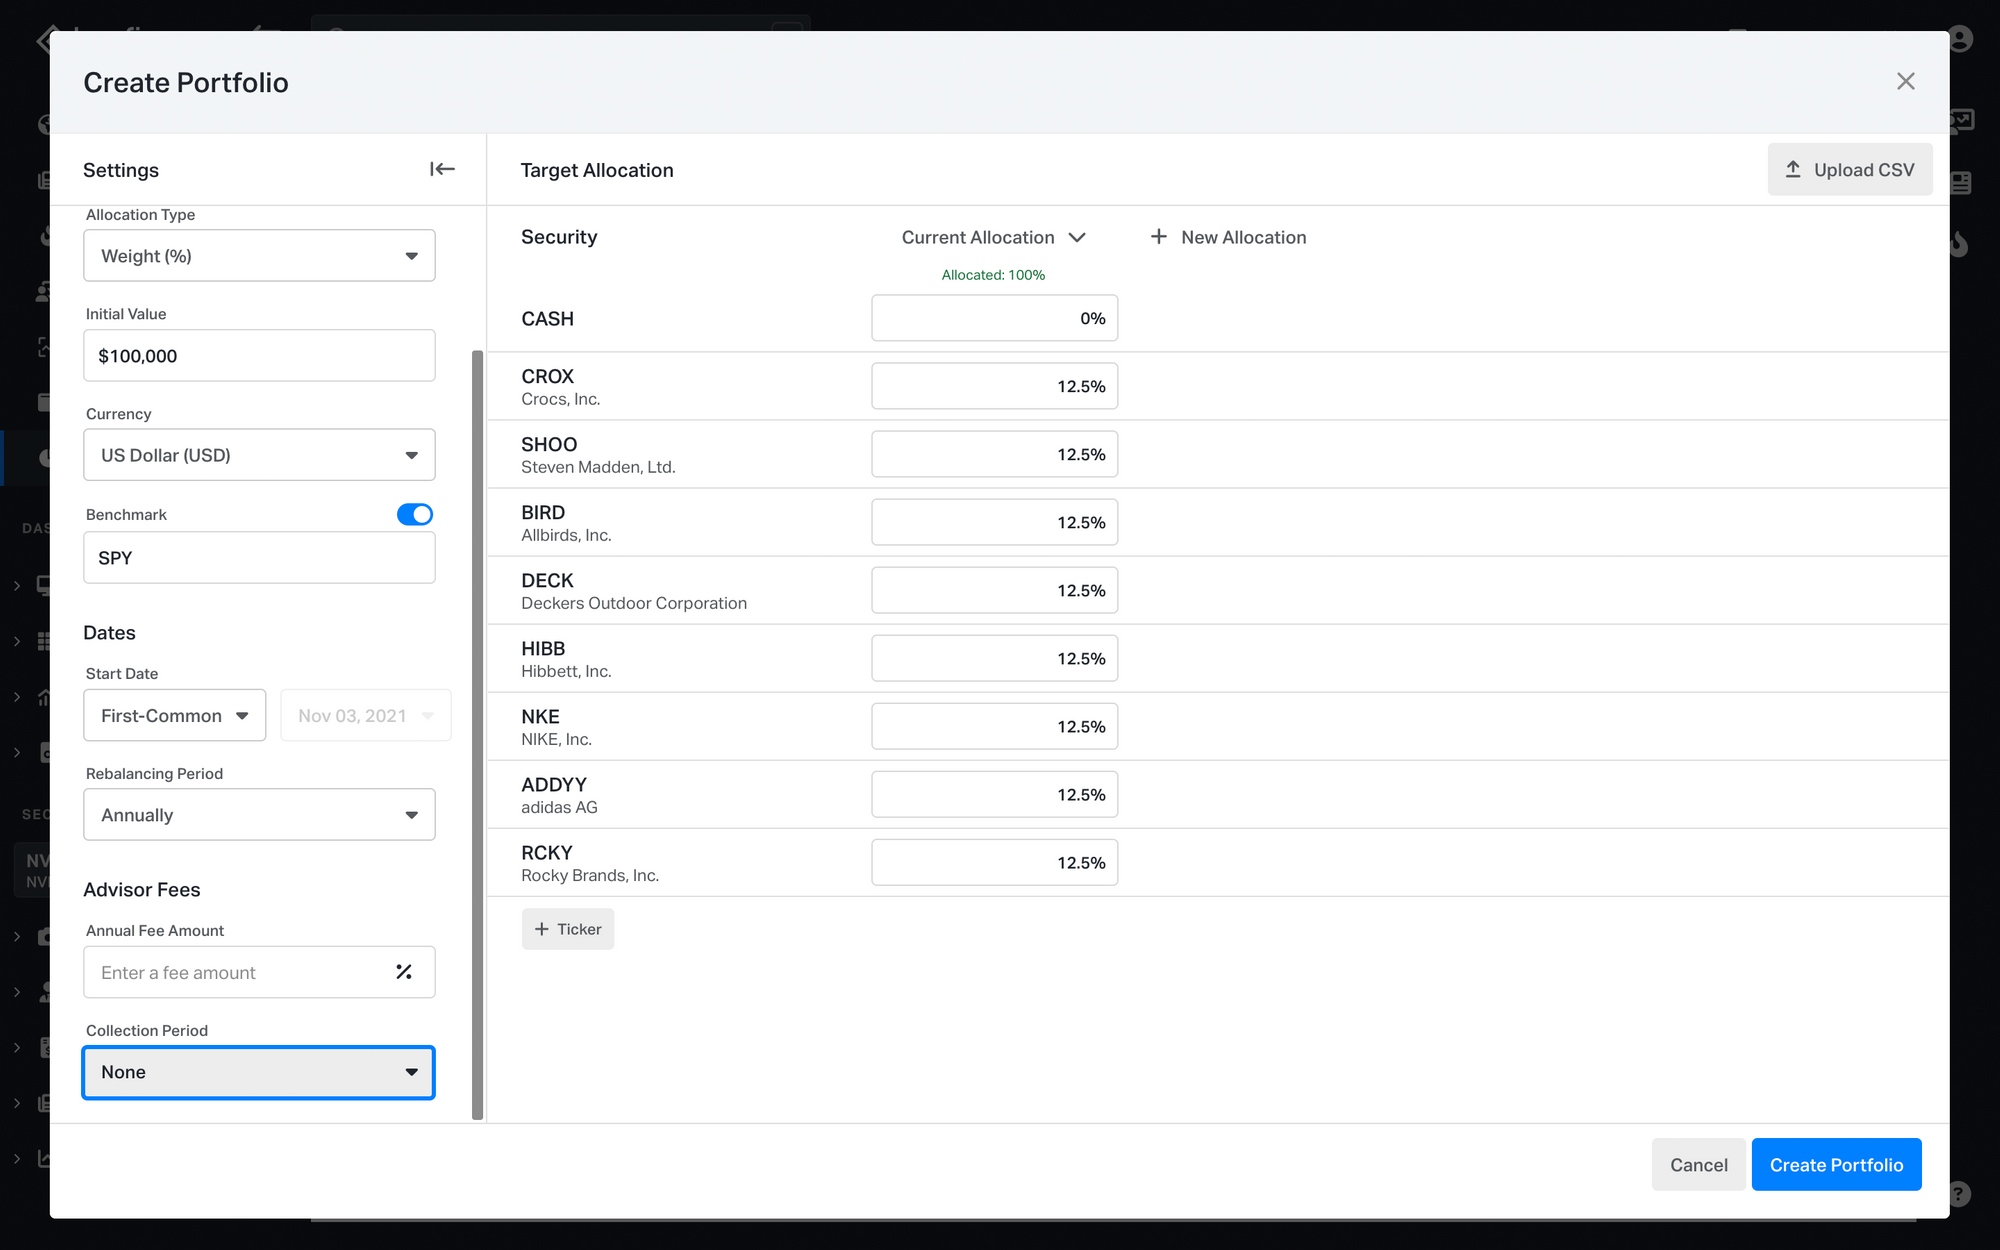
7. After configuring all the settings, click the 'Create Portfolio' button.
2. Utilize Screener for Efficient Model Creation
If you don't have a list of tickers but want to find companies for your custom index, you can use the screener. The screener allows you to filter securities based on criteria such as region or industry, helping you identify companies to include in your baskets. Let's create a new screen as an example:
- Open the Screener and click '+' to create a new screen.
2. Choose the region you want to filter by. For example, we will include these trading regions: US, Canada, and Europe.
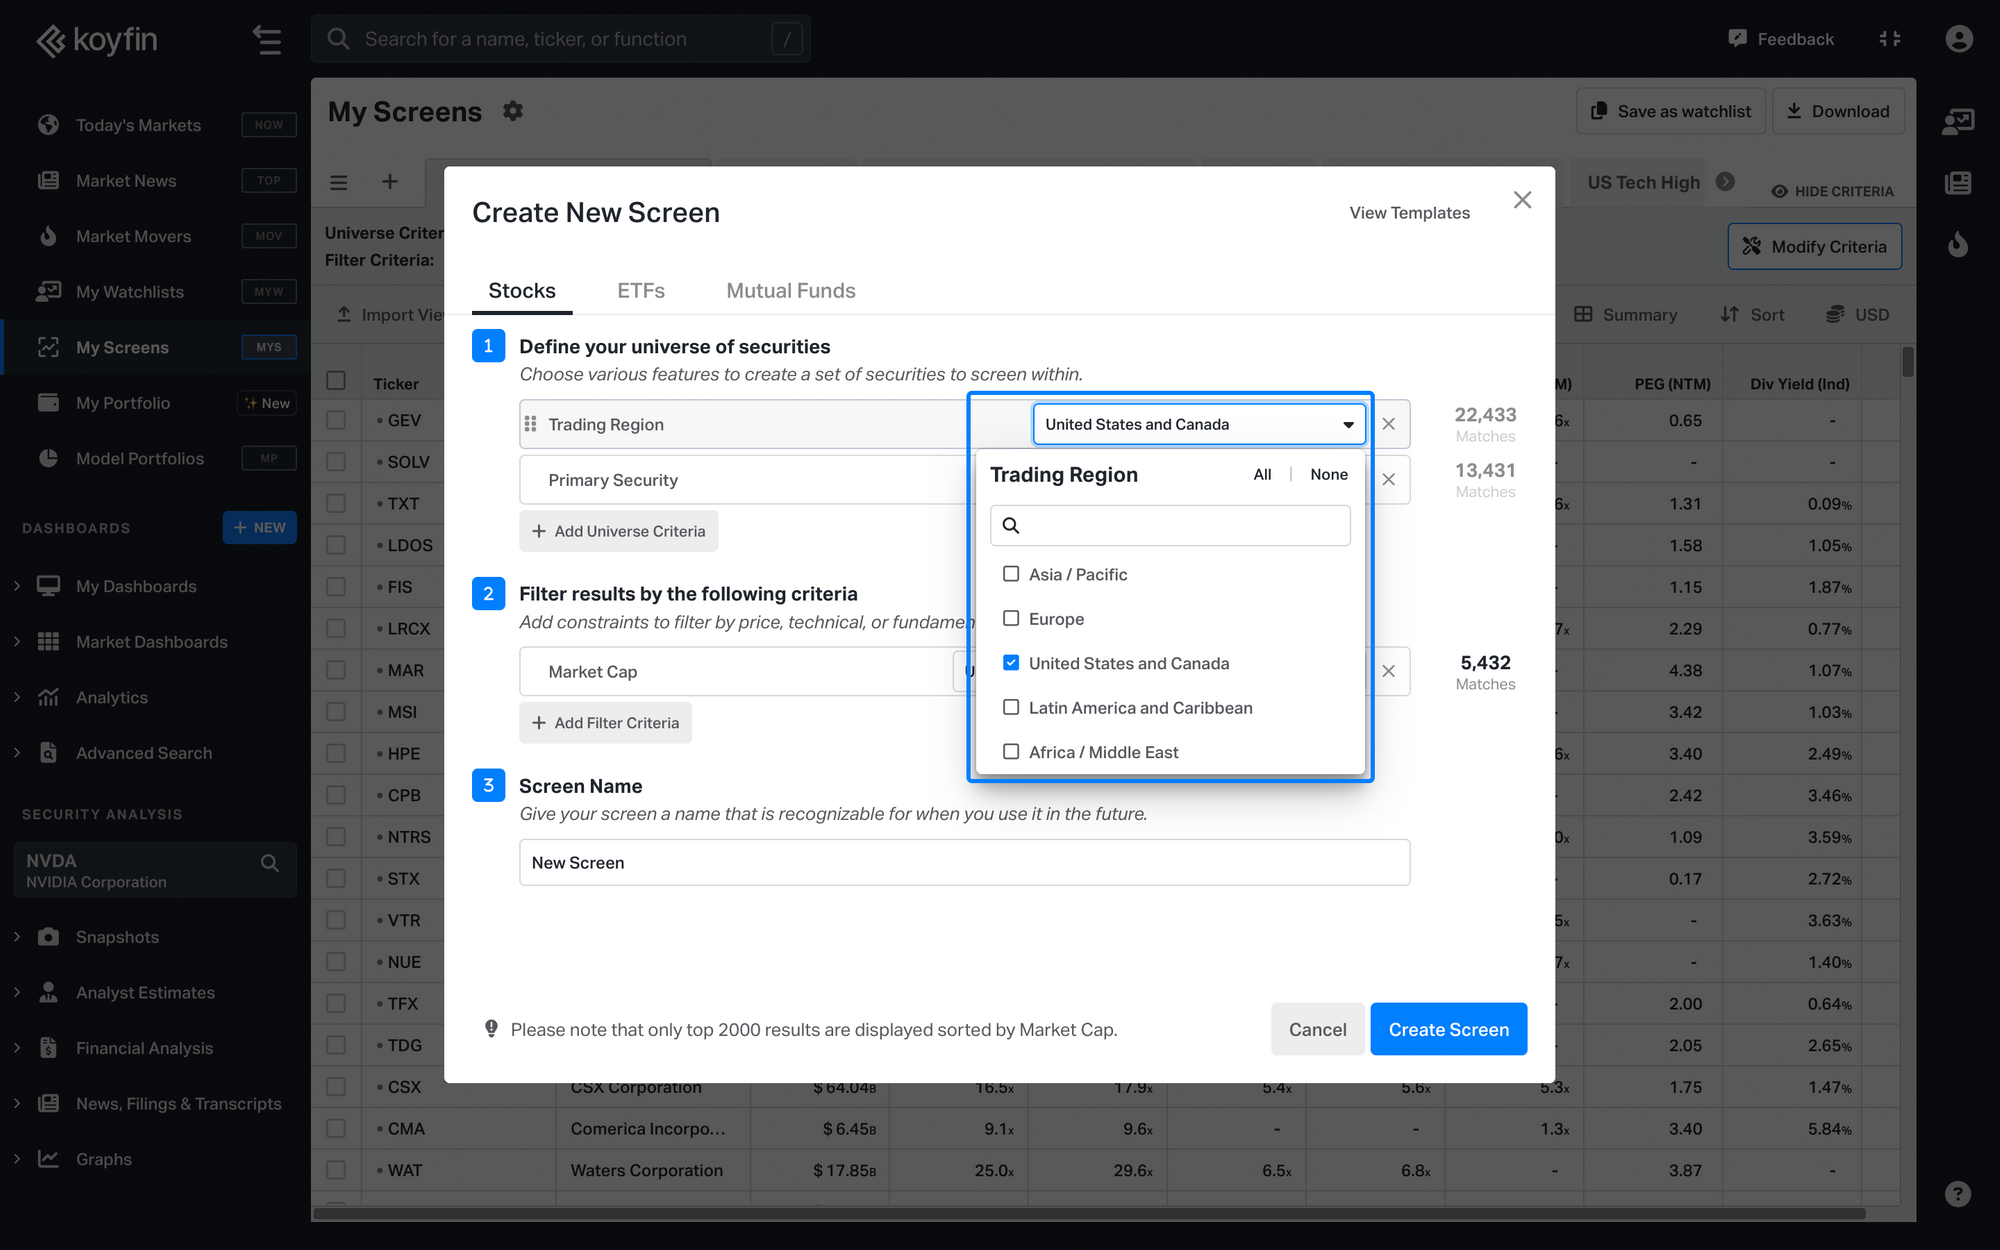
3. Select the industry you are interested in. For example, we will select automobiles.
4. Choose criteria to filter the results. You can filter by price, technicals, or fundamental data series. For example, we will filter only by market cap.
5. Name your screen and click 'Create Screen' to see the list of companies that meet your criteria.

Now you can add these companies to a custom index for further analysis. Follow these steps to create a model portfolio (custom index) after your screener is ready:
- Export the screener results as a CSV file.
Note: Our data vendor, Capital IQ, restricts certain data from being downloaded. Metrics such as equity financials, valuation, estimates, and growth rates cannot be exported.
2. Go to the Model Portfolios, click on 'Create New', and choose the CSV import option. Then upload the CSV file with your screener results, and make sure you have the proper columns in the CSV: Ticker, Weight and Date are mandatory fields. You can use today’s date in the date field.

3. Proceed through all the steps by clicking 'Next.' By following these steps, you can easily create a model portfolio based on your screener results for further analysis.
3. Analyze Your Model Portfolios
Once your custom index is created, you can analyze its performance and other metrics by creating a watchlist and adding your custom indices to the watchlist. Customize the columns to display the most relevant performance data.
4. Visual Analysis with LOTS
The lots of charts feature allows you to visualize multiple securities or models simultaneously:
- Navigate to the lots of charts feature.
2. Load the watchlist containing your custom indices.
3. Choose a layout that will showcase all of your custom indices.
5. Create and Apply Chart Templates
You can create chart templates to view specific data points such as historical price, performance, or custom indicators. These templates can then be applied in the lots of charts feature with your custom indices for a more comprehensive analysis.
1. Customize your chart view by adding indicators and save it as a template. For example, we will have historical price and simple moving average (SMA) in our template.
2. Apply it across different charts in lots of charts for consistent analysis.
By following these steps, you can effectively create and track custom sub-industries in Koyfin, enhancing your investment analysis and decision-making process.
Watch this video to see how you can seamlessly integrate model portfolios, watchlists, and lots of charts to enhance your financial analysis.