This powerful feature empowers users to build, analyze, and manage Model Portfolios. You can visualize portfolio performance, analyze risk metrics, and iterate on your target allocation.
Model Portfolios functionality is available in the Pro plan.
Create your personal model portfolio here.
Getting Started
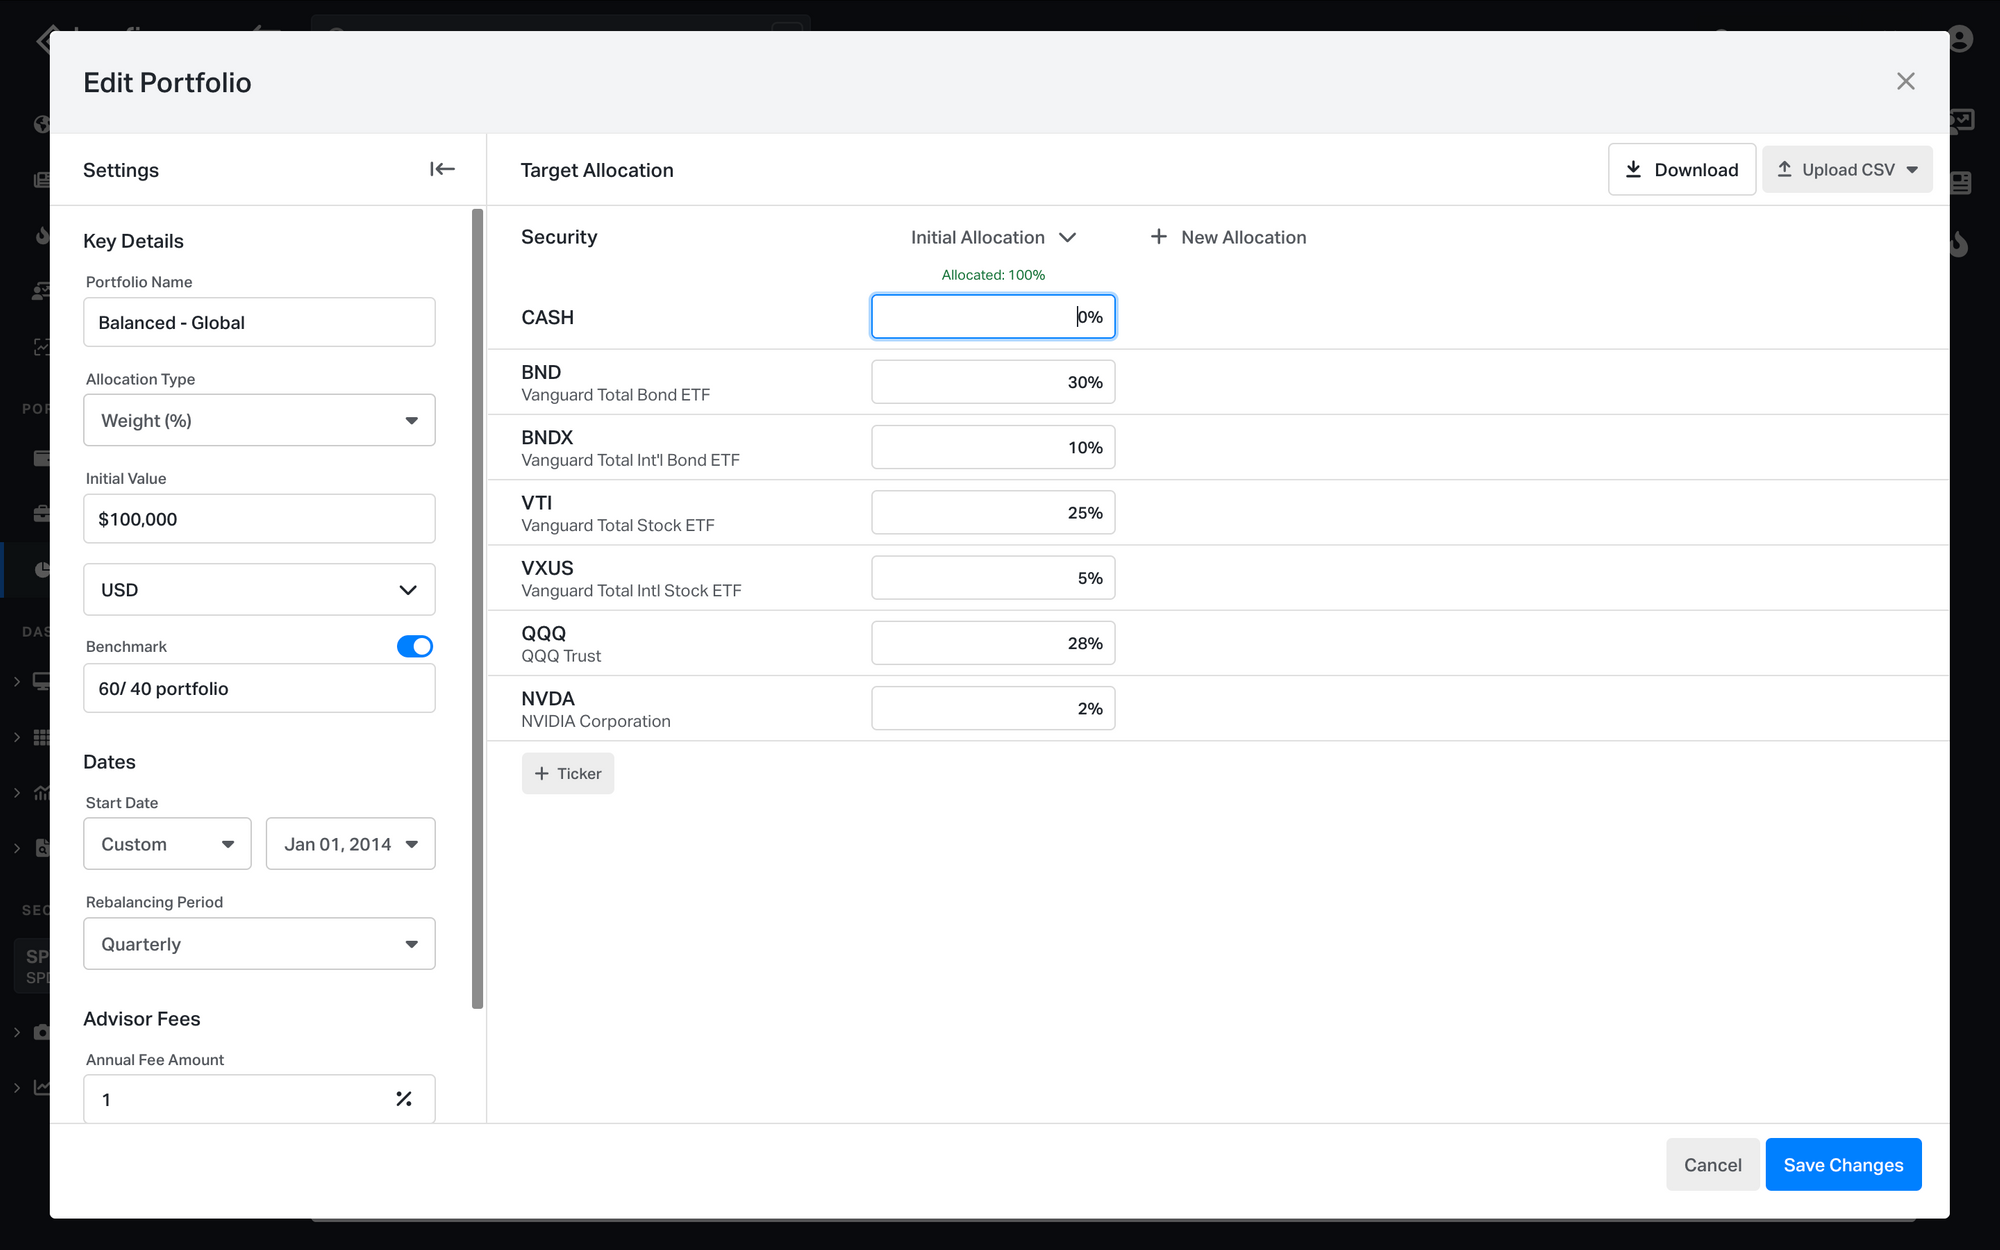
Start building a portfolio by adding securities and target weights. The CASH pictured below has no risk and no return in the portfolio currency. All portfolio performance and risk metrics will be based on position adjusted close prices and total returns for stocks, ETFs, and Mutual Funds.
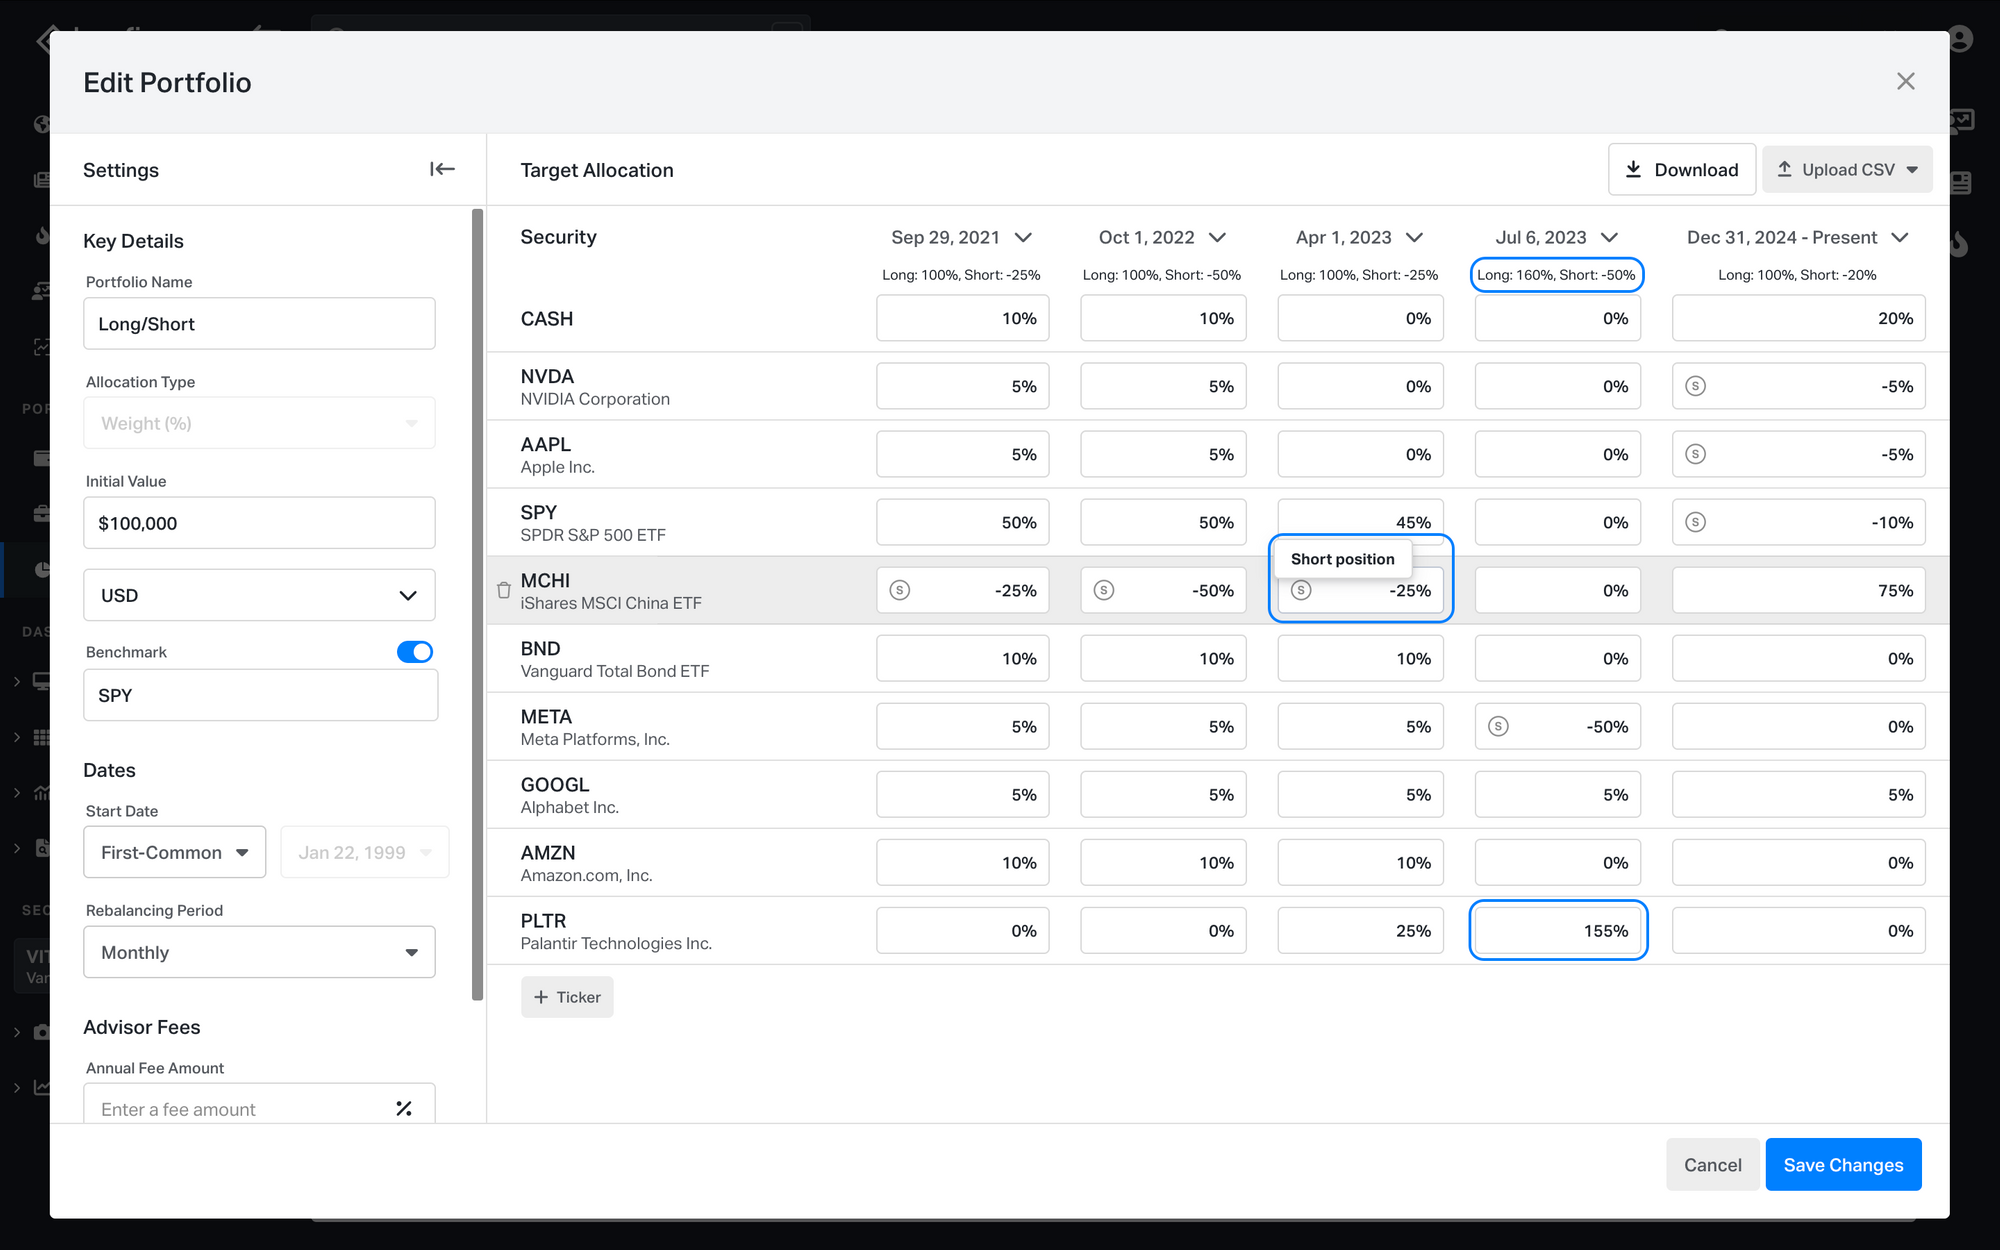
Long/Short & Leveraged Model Portfolios
Add negative weights for short positions, allocate over 100% to use leverage, and dynamically adjust the allocations over time.
Shorts and leveraged holdings will be factored into performance, risk metrics, exposure breakdowns, and reports.
Portfolio Snapshots
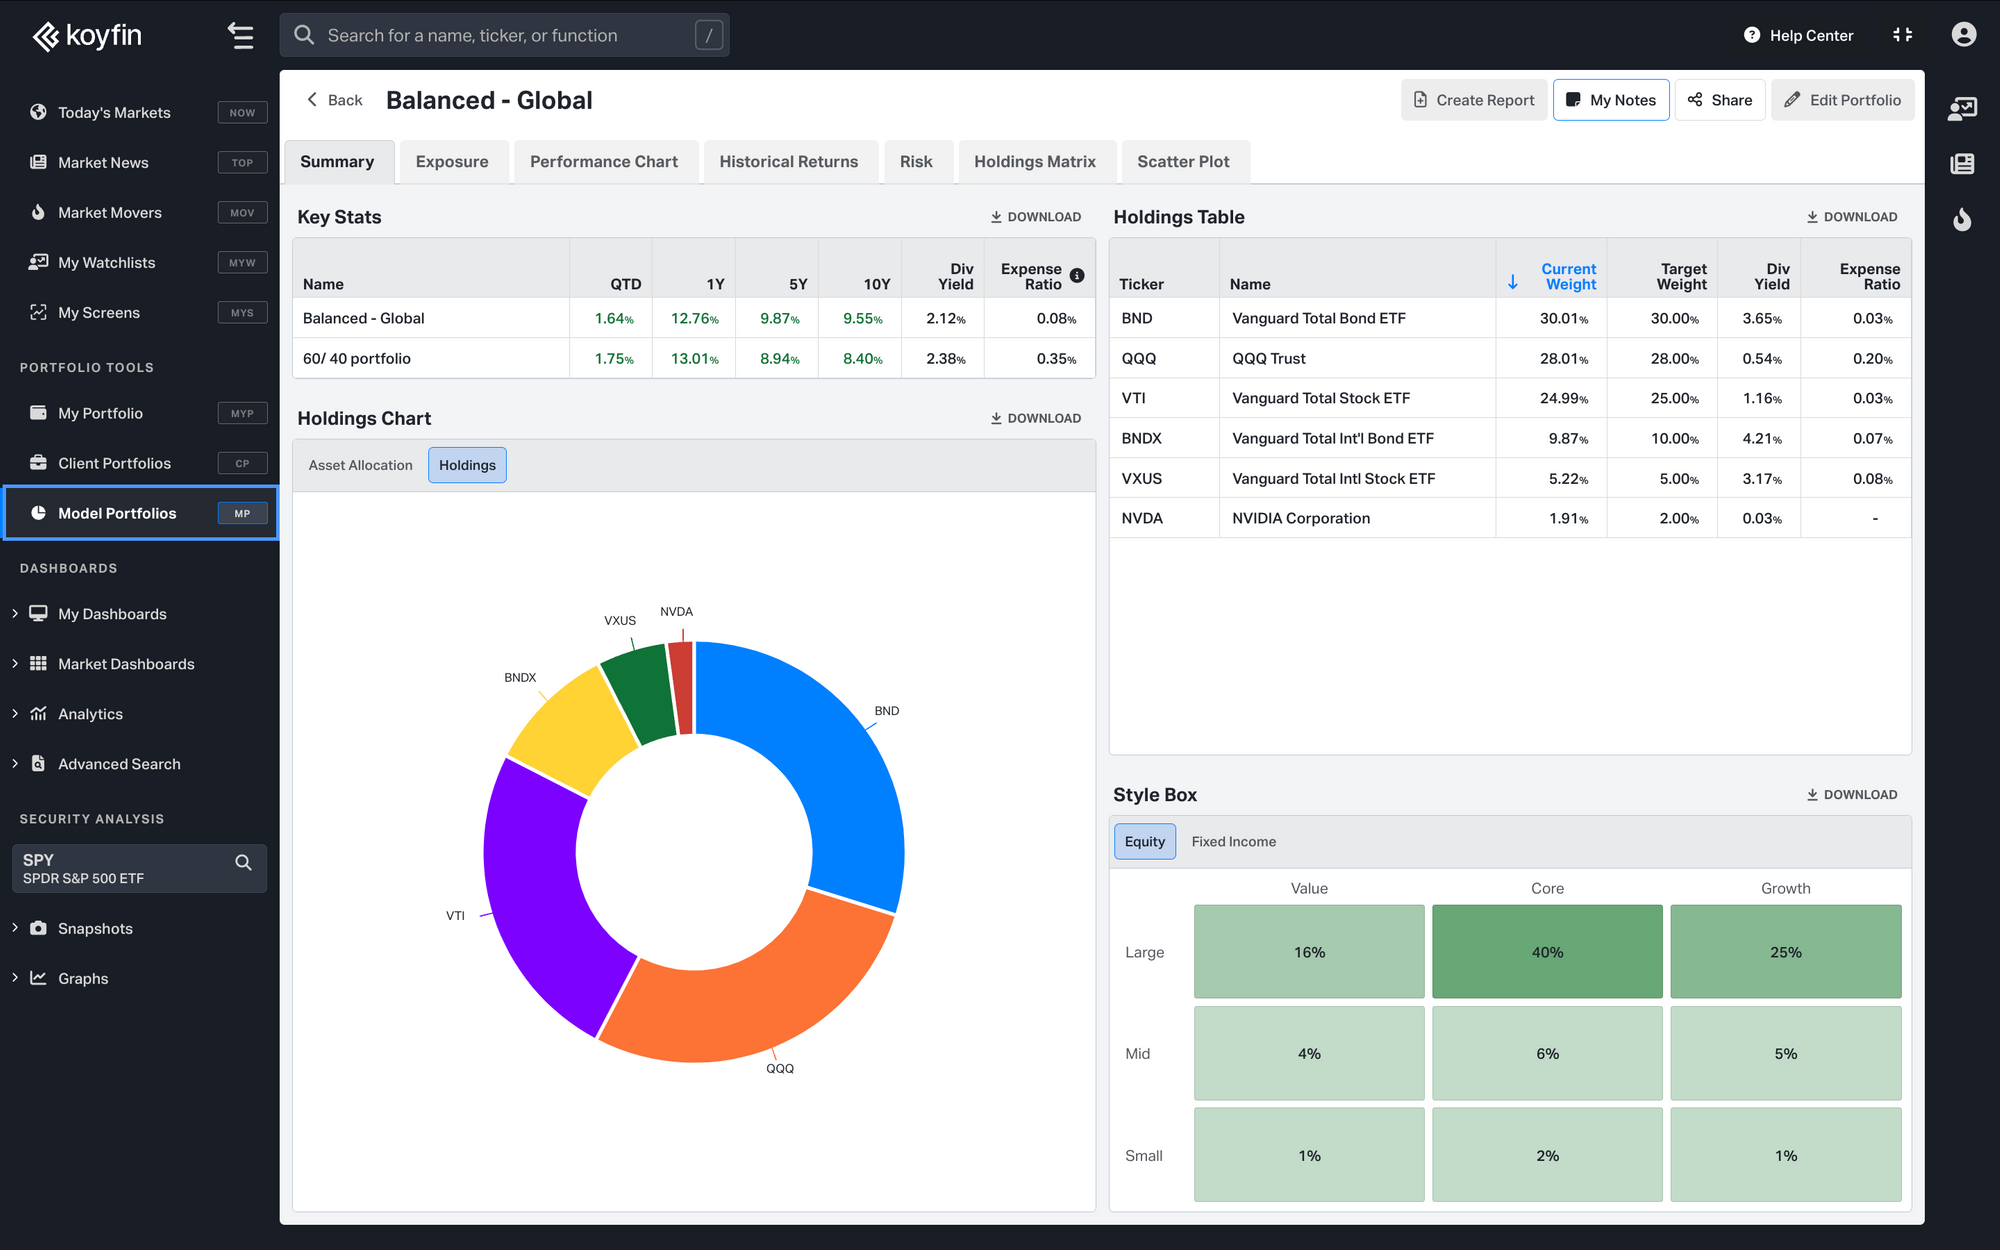
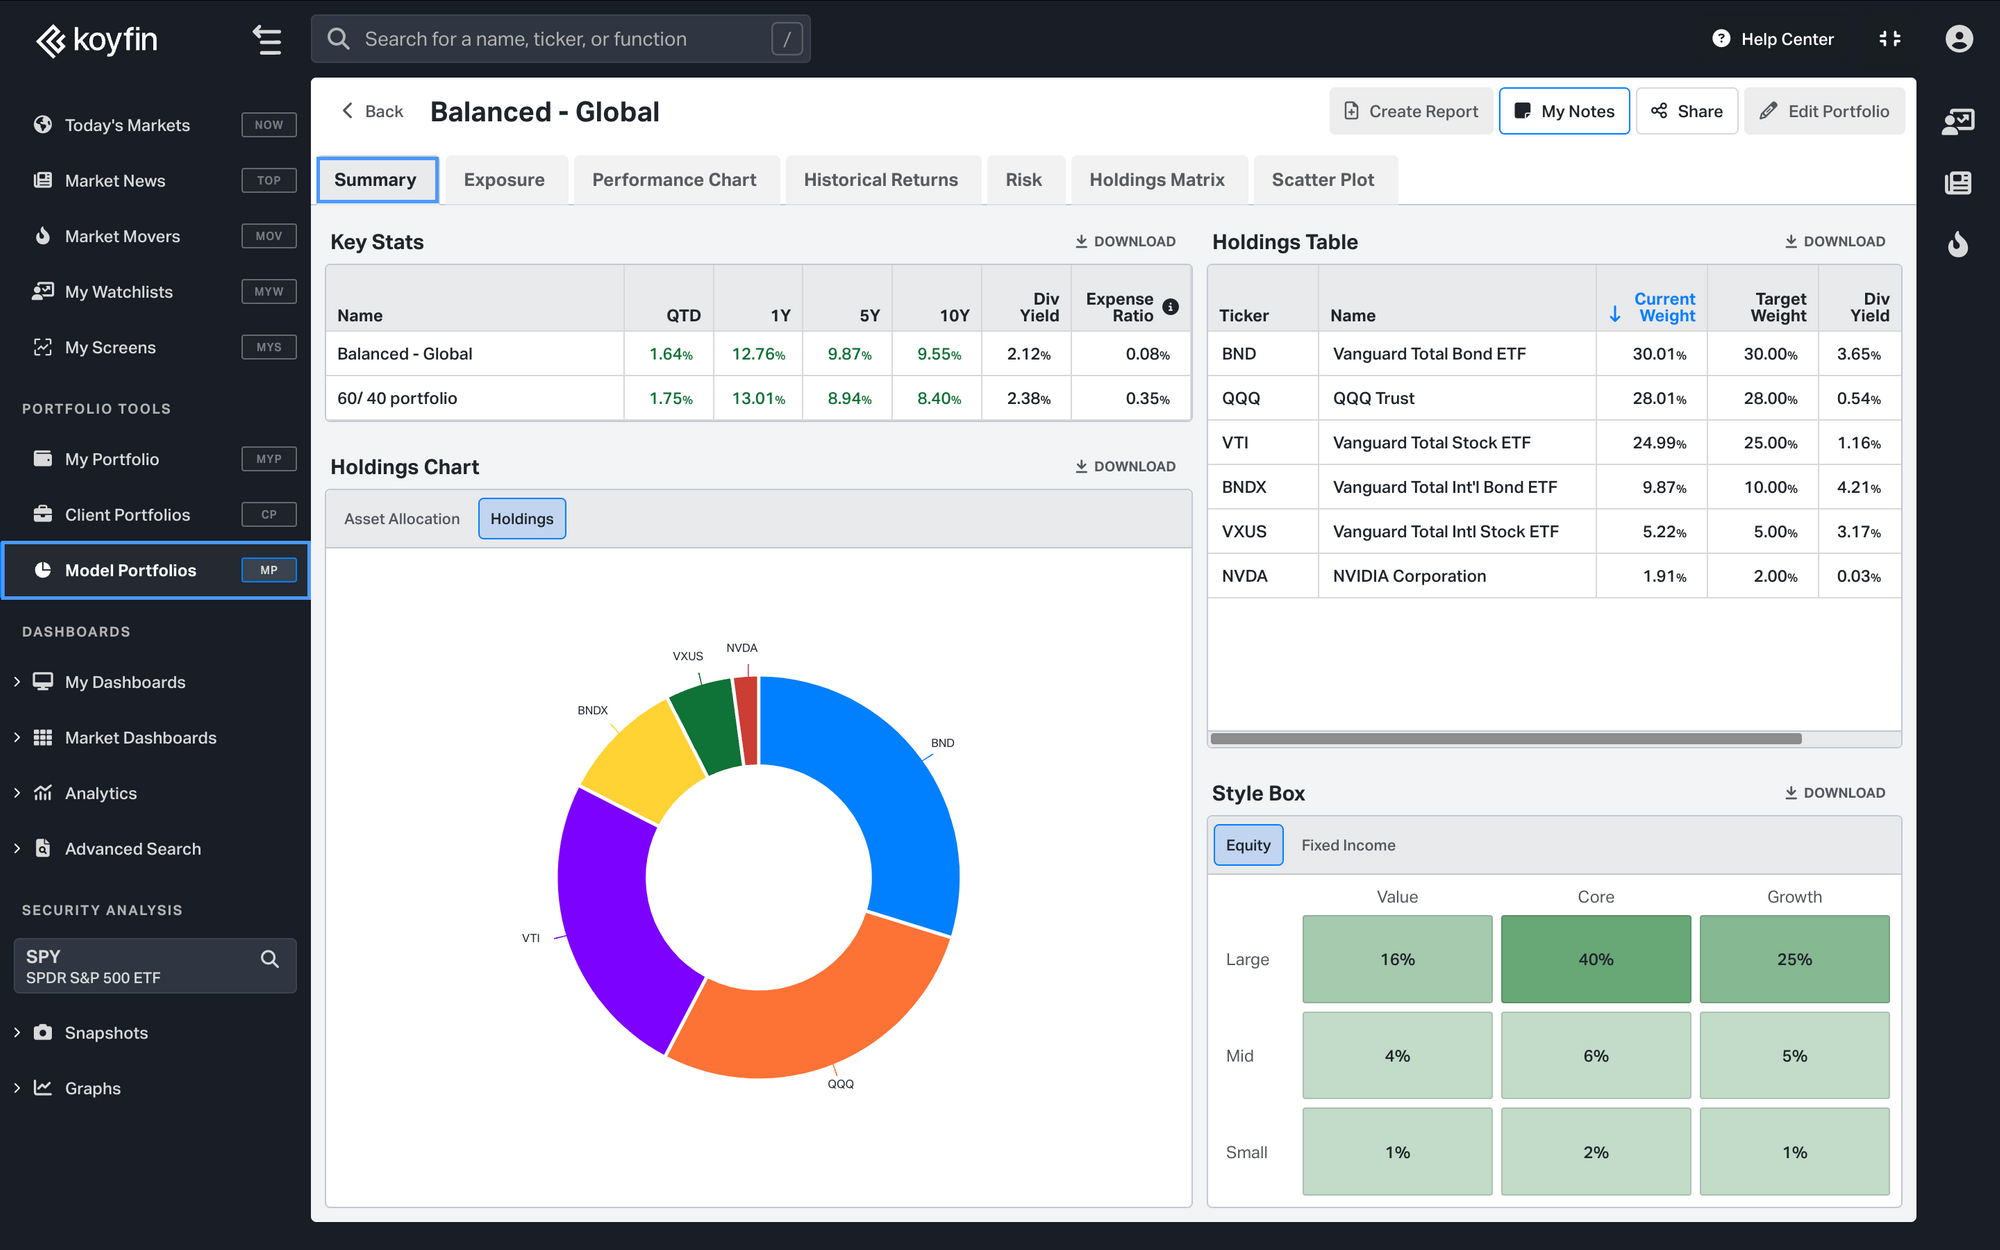
In the Summary snapshot view key stats for the portfolio and benchmark, visualize Model Portfolio holdings, and monitor how your current position weights have drifted from the target allocation.
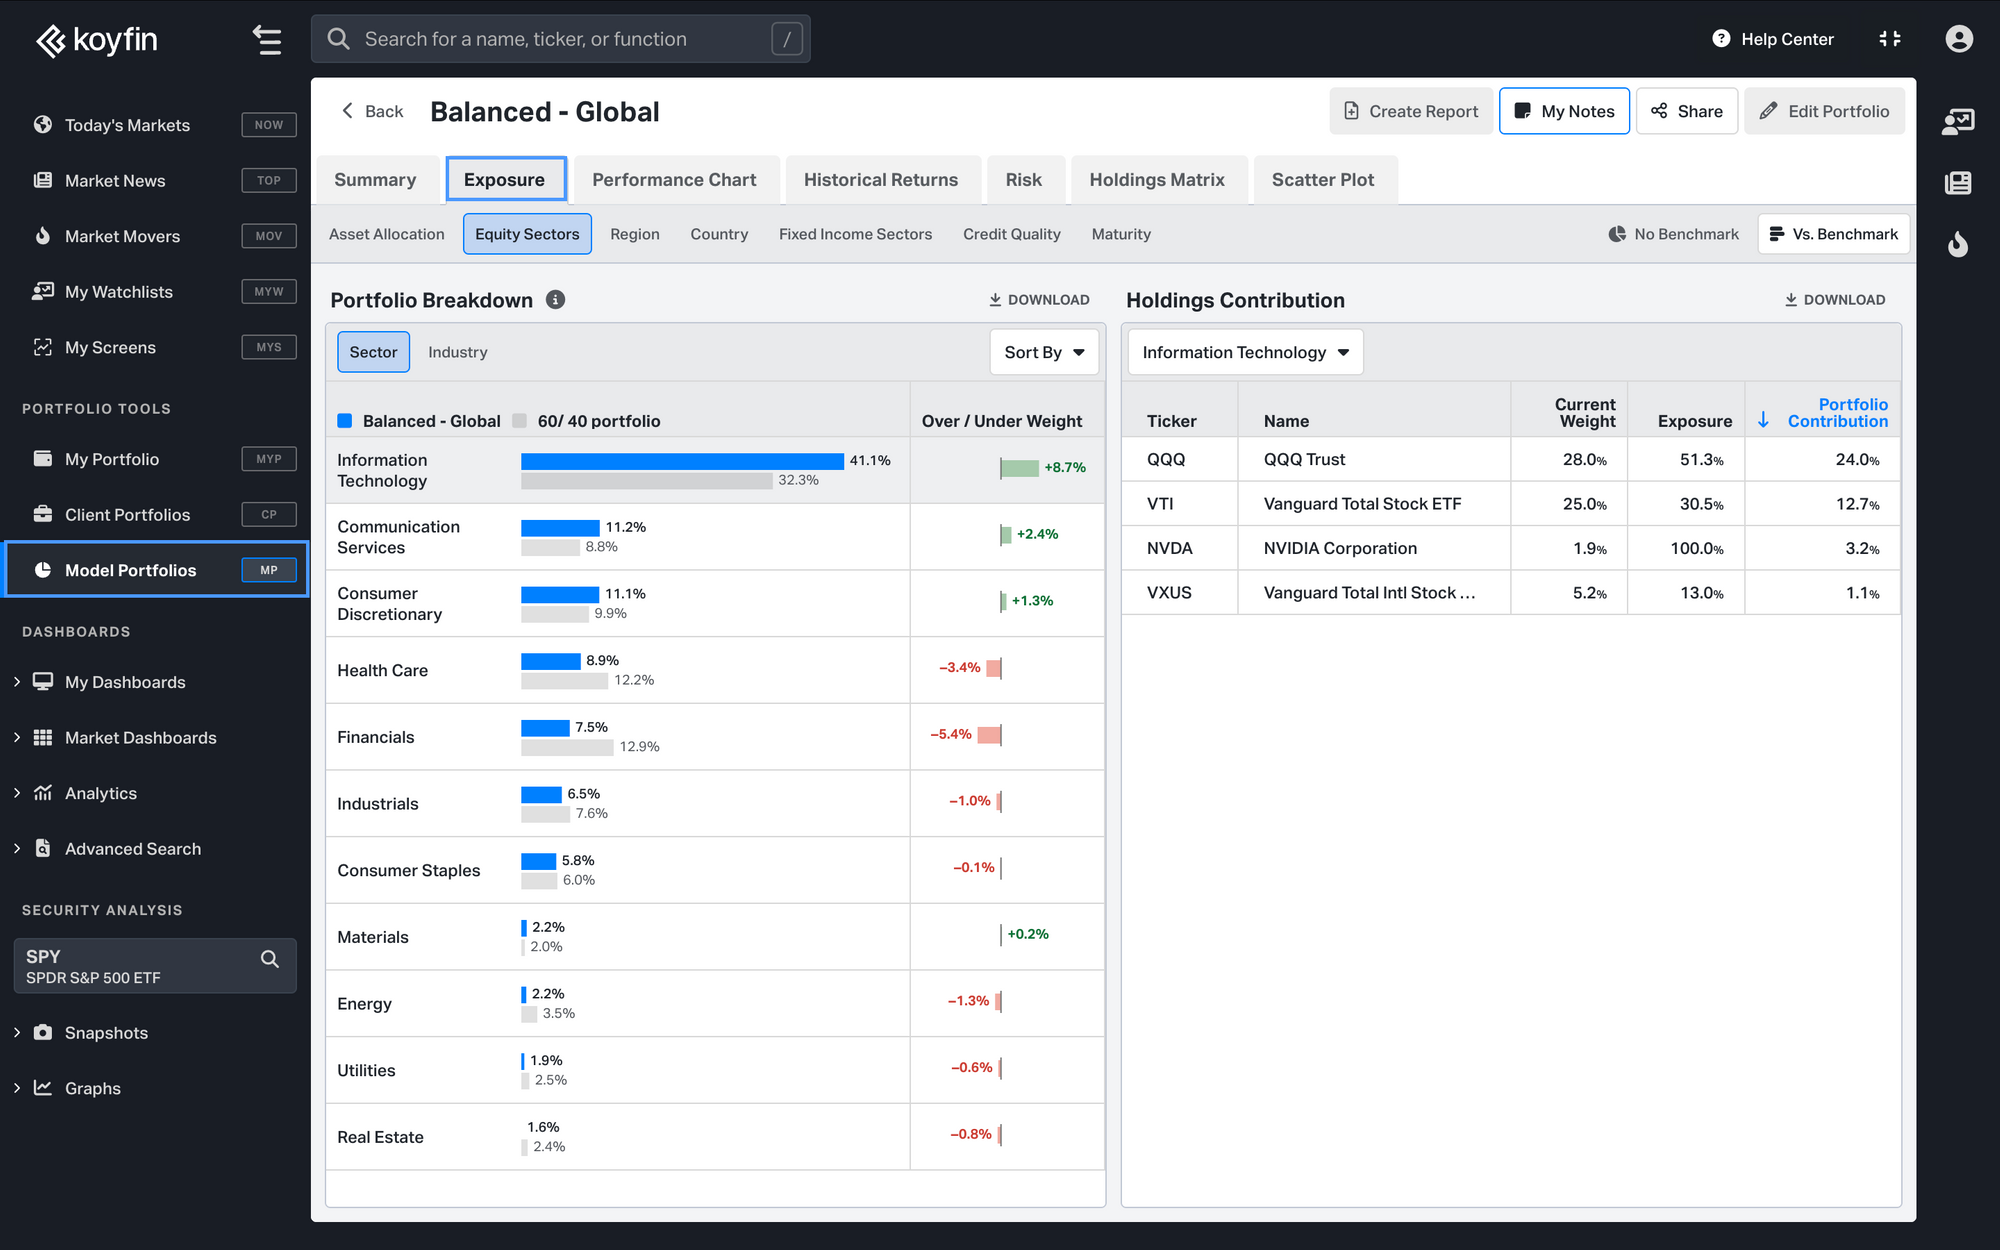
View Exposure for your Model Portfolio by asset class, sector, region, and more. Compare portfolio exposures against a benchmark and dive into which holdings are contributing to large exposures. Click here for extensive details on Exposure.
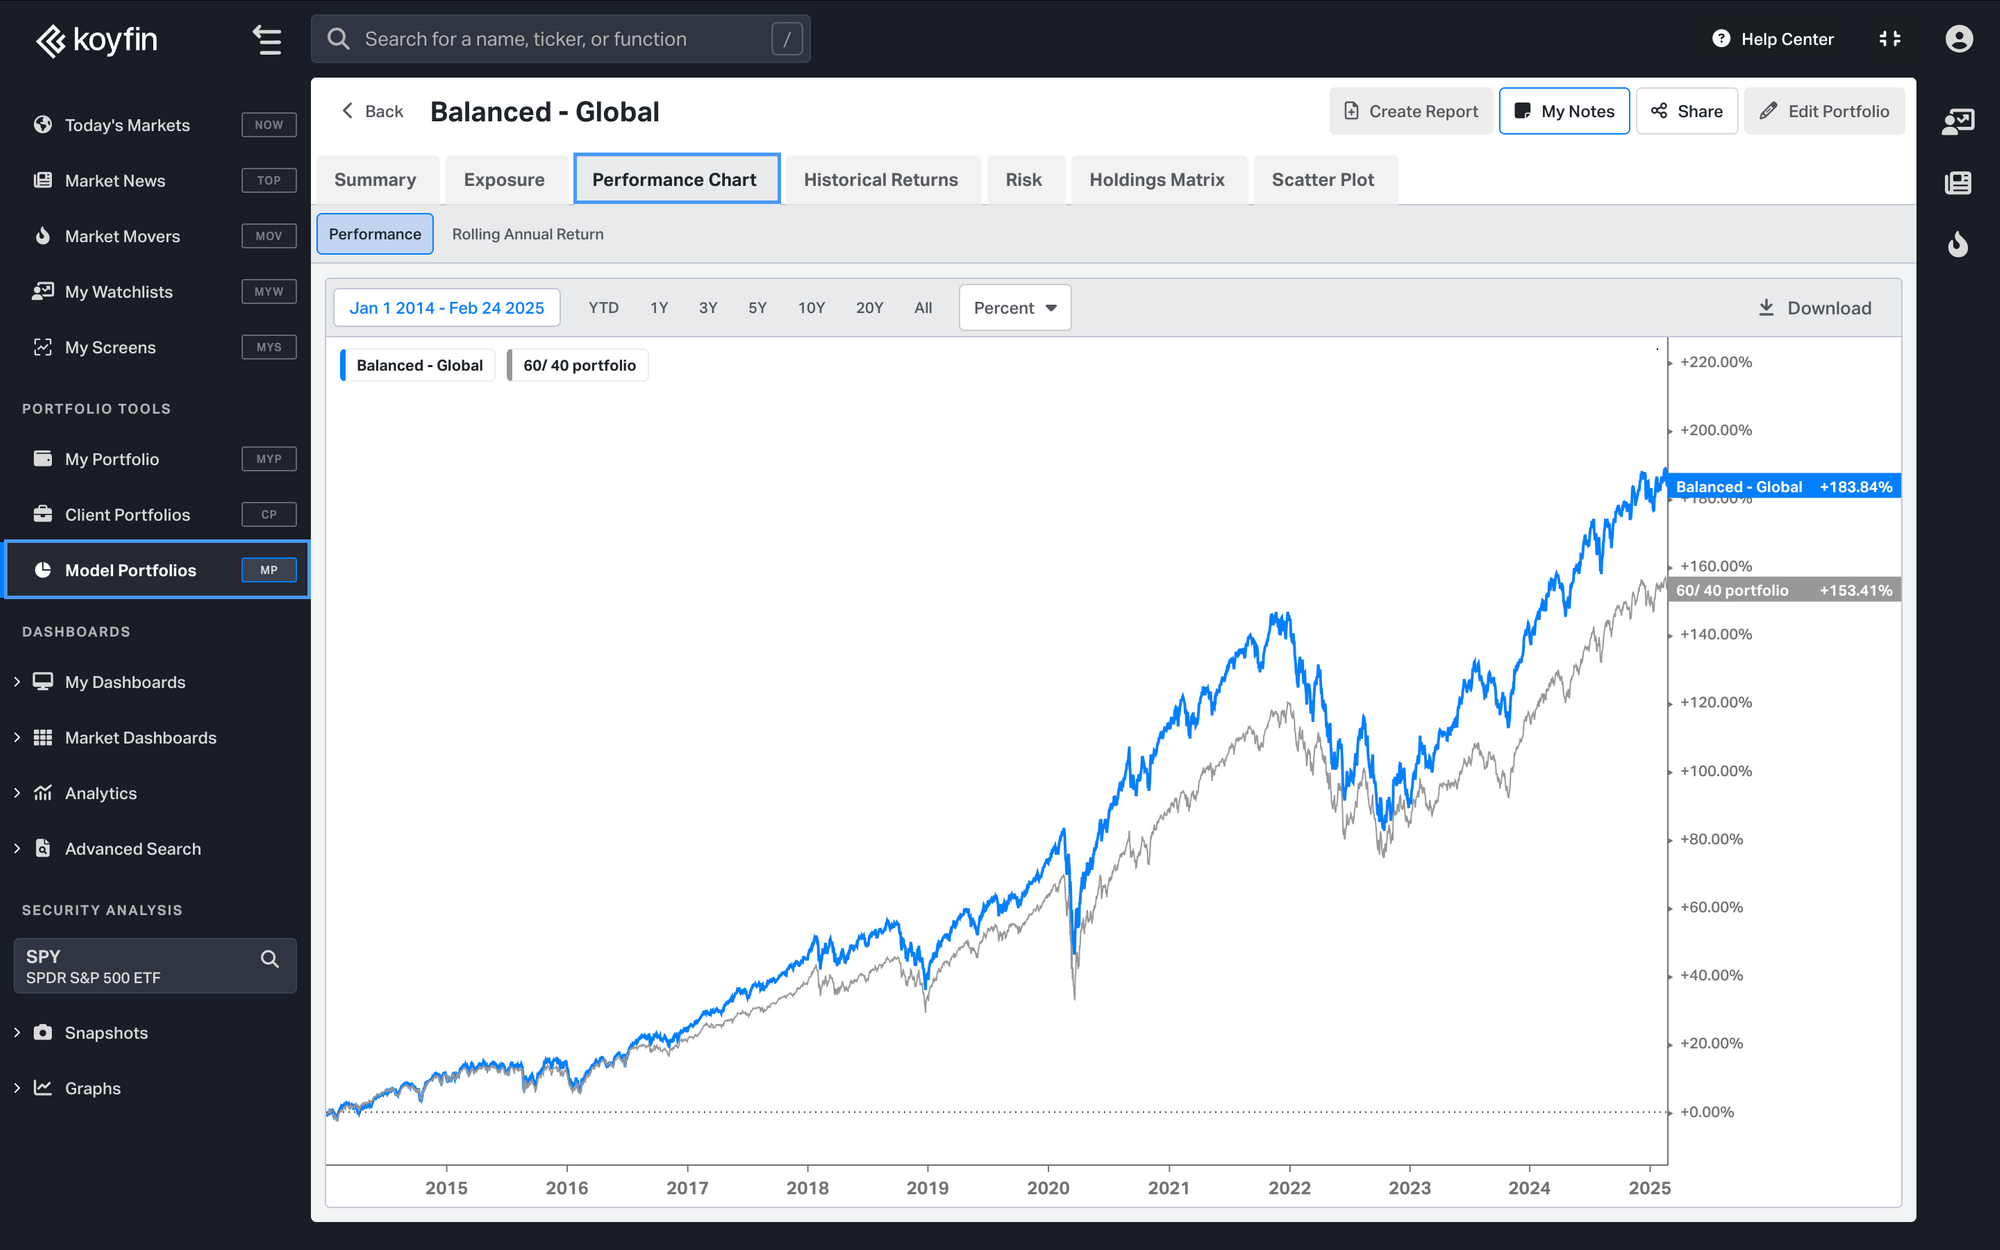
Visualize performance against your benchmark in our Performance Chart snapshot. Set customized time frames to track performance over your preferred durations. View cumulative returns or portfolio growth (e.g., from an initial $100,000).
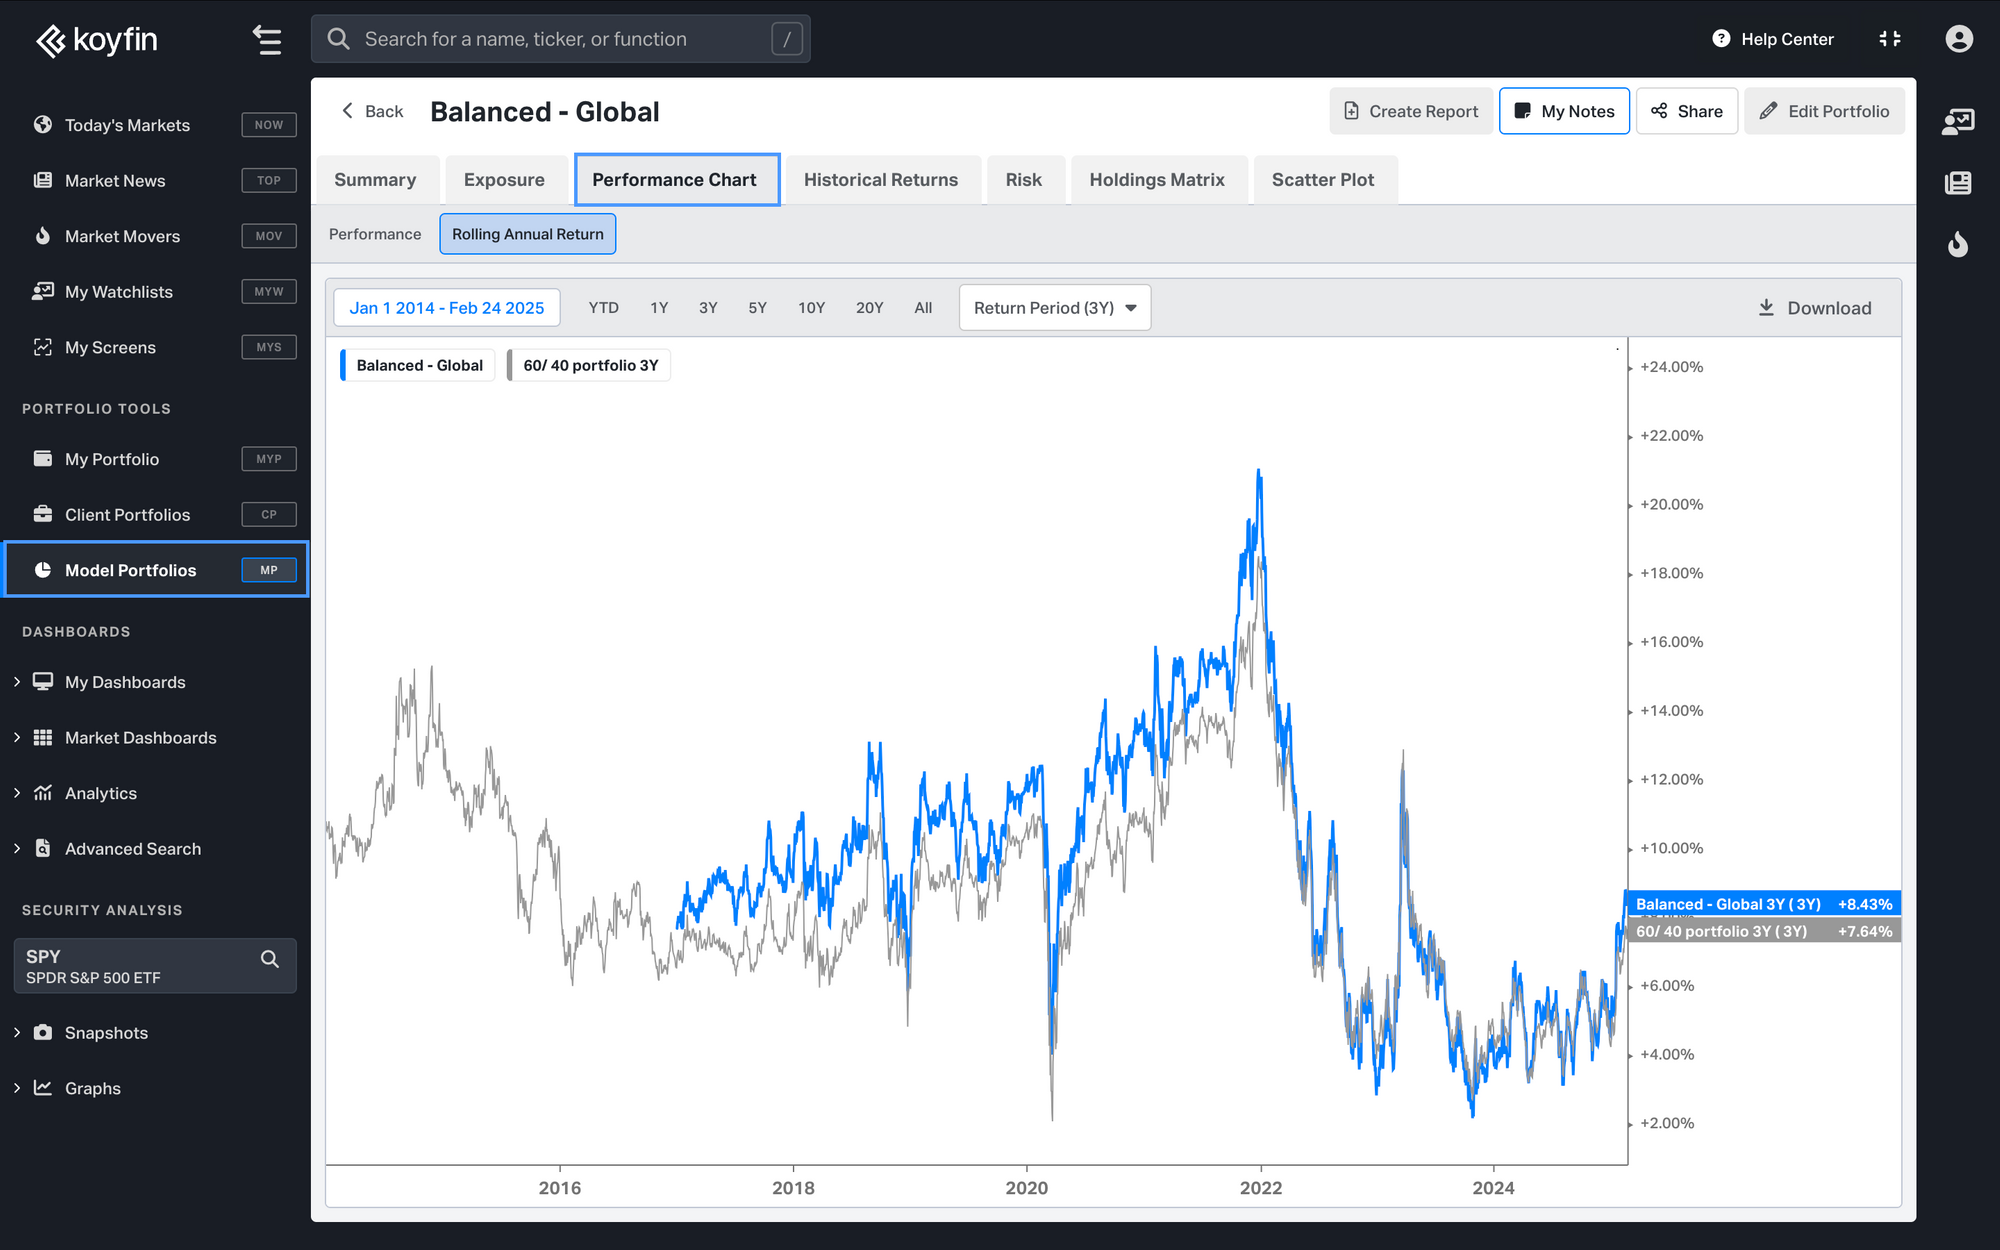
Select rolling returns to better understand when the portfolio either outperformed or underperformed. Rolling returns can be 1-year, 3-year or 5-year. For example, if 3-year is selected, each point represents the historical 3-year return on that day.
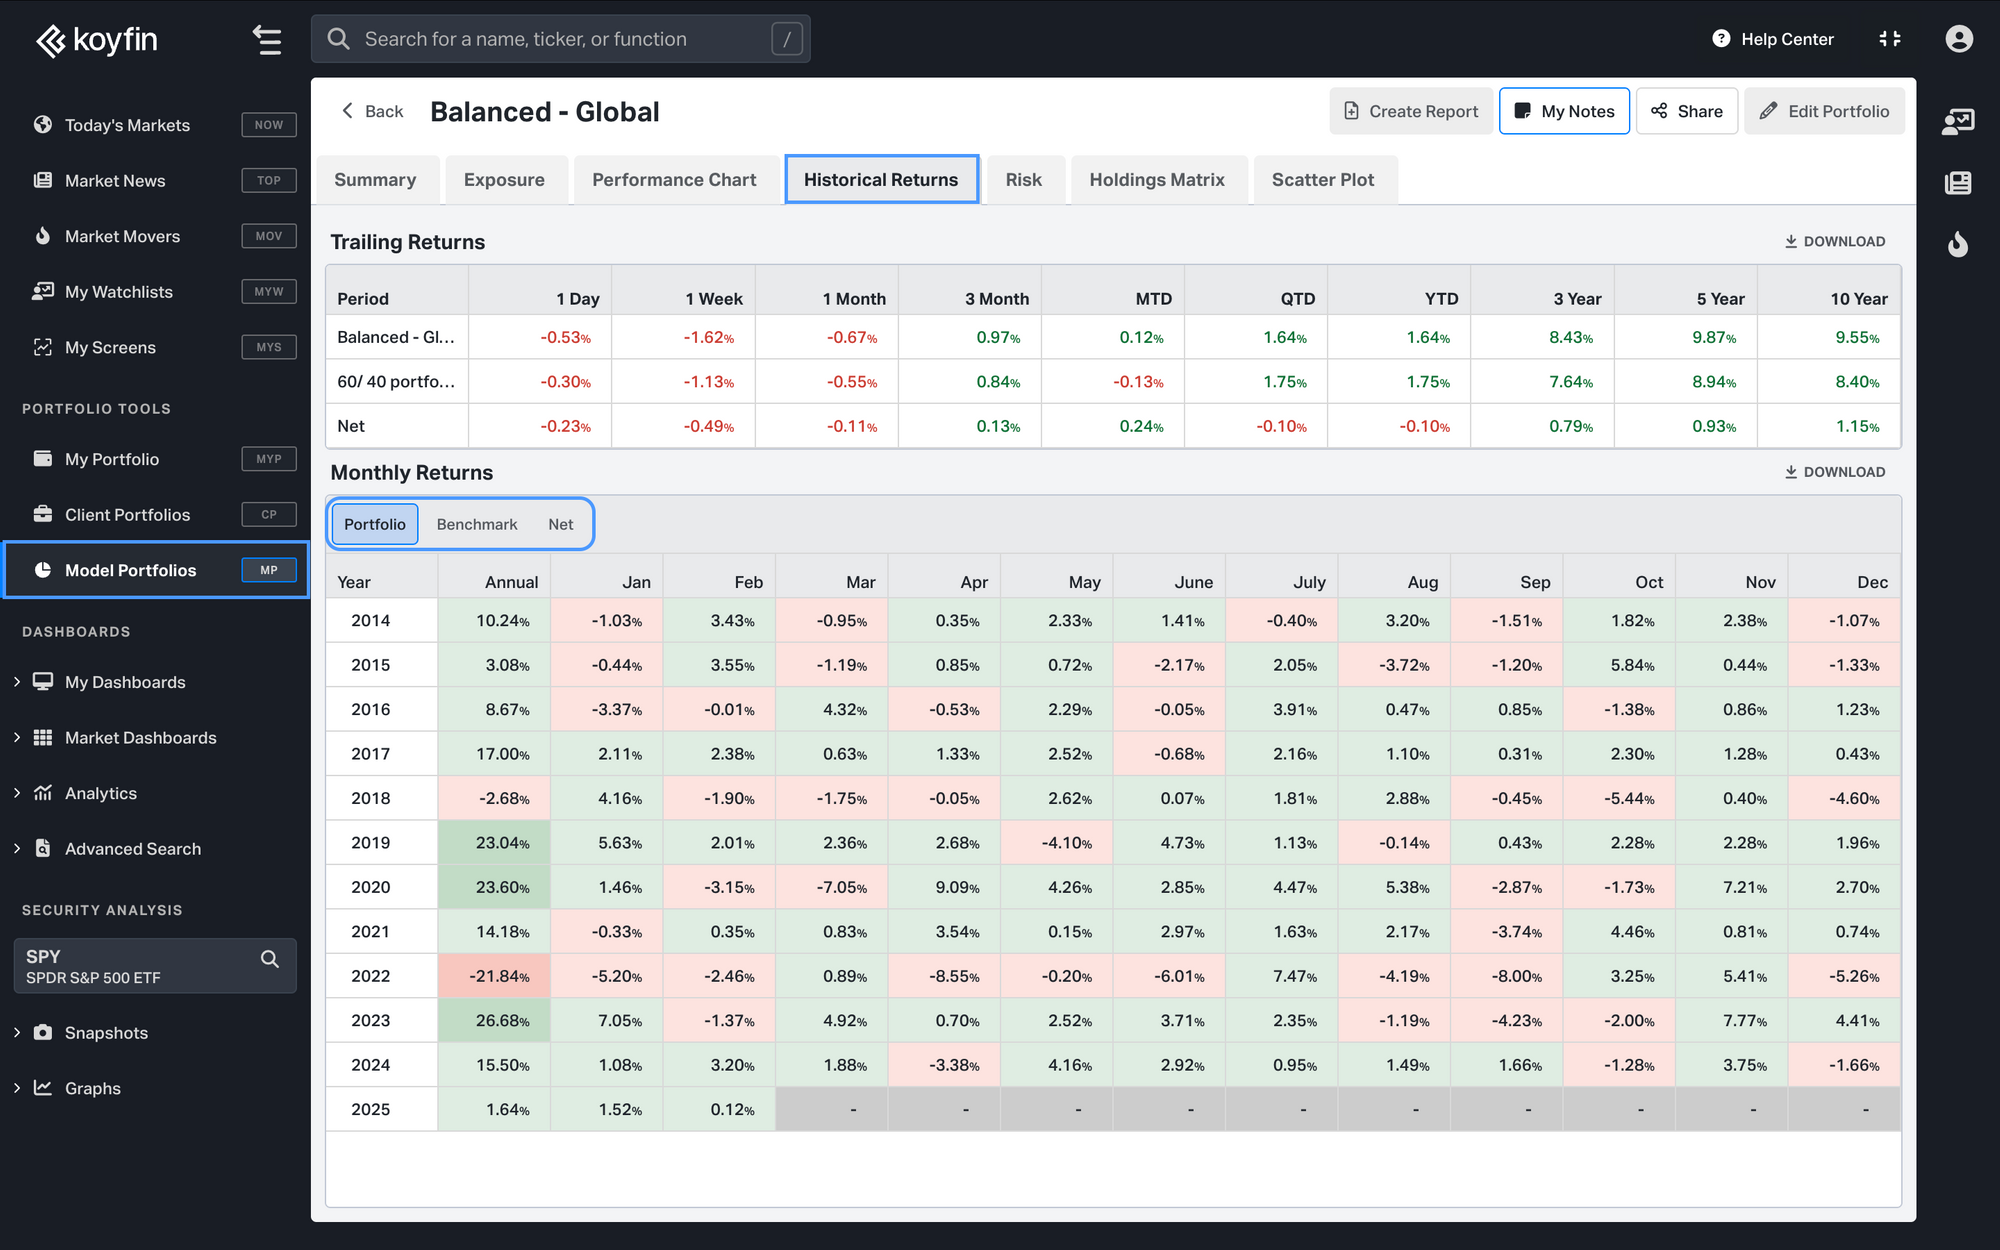
Performance can be viewed more comprehensively in our Historical Returns snapshot. Here you can see trailing returns as well as monthly and annual returns for the portfolio. Everything can be viewed alongside your benchmark.
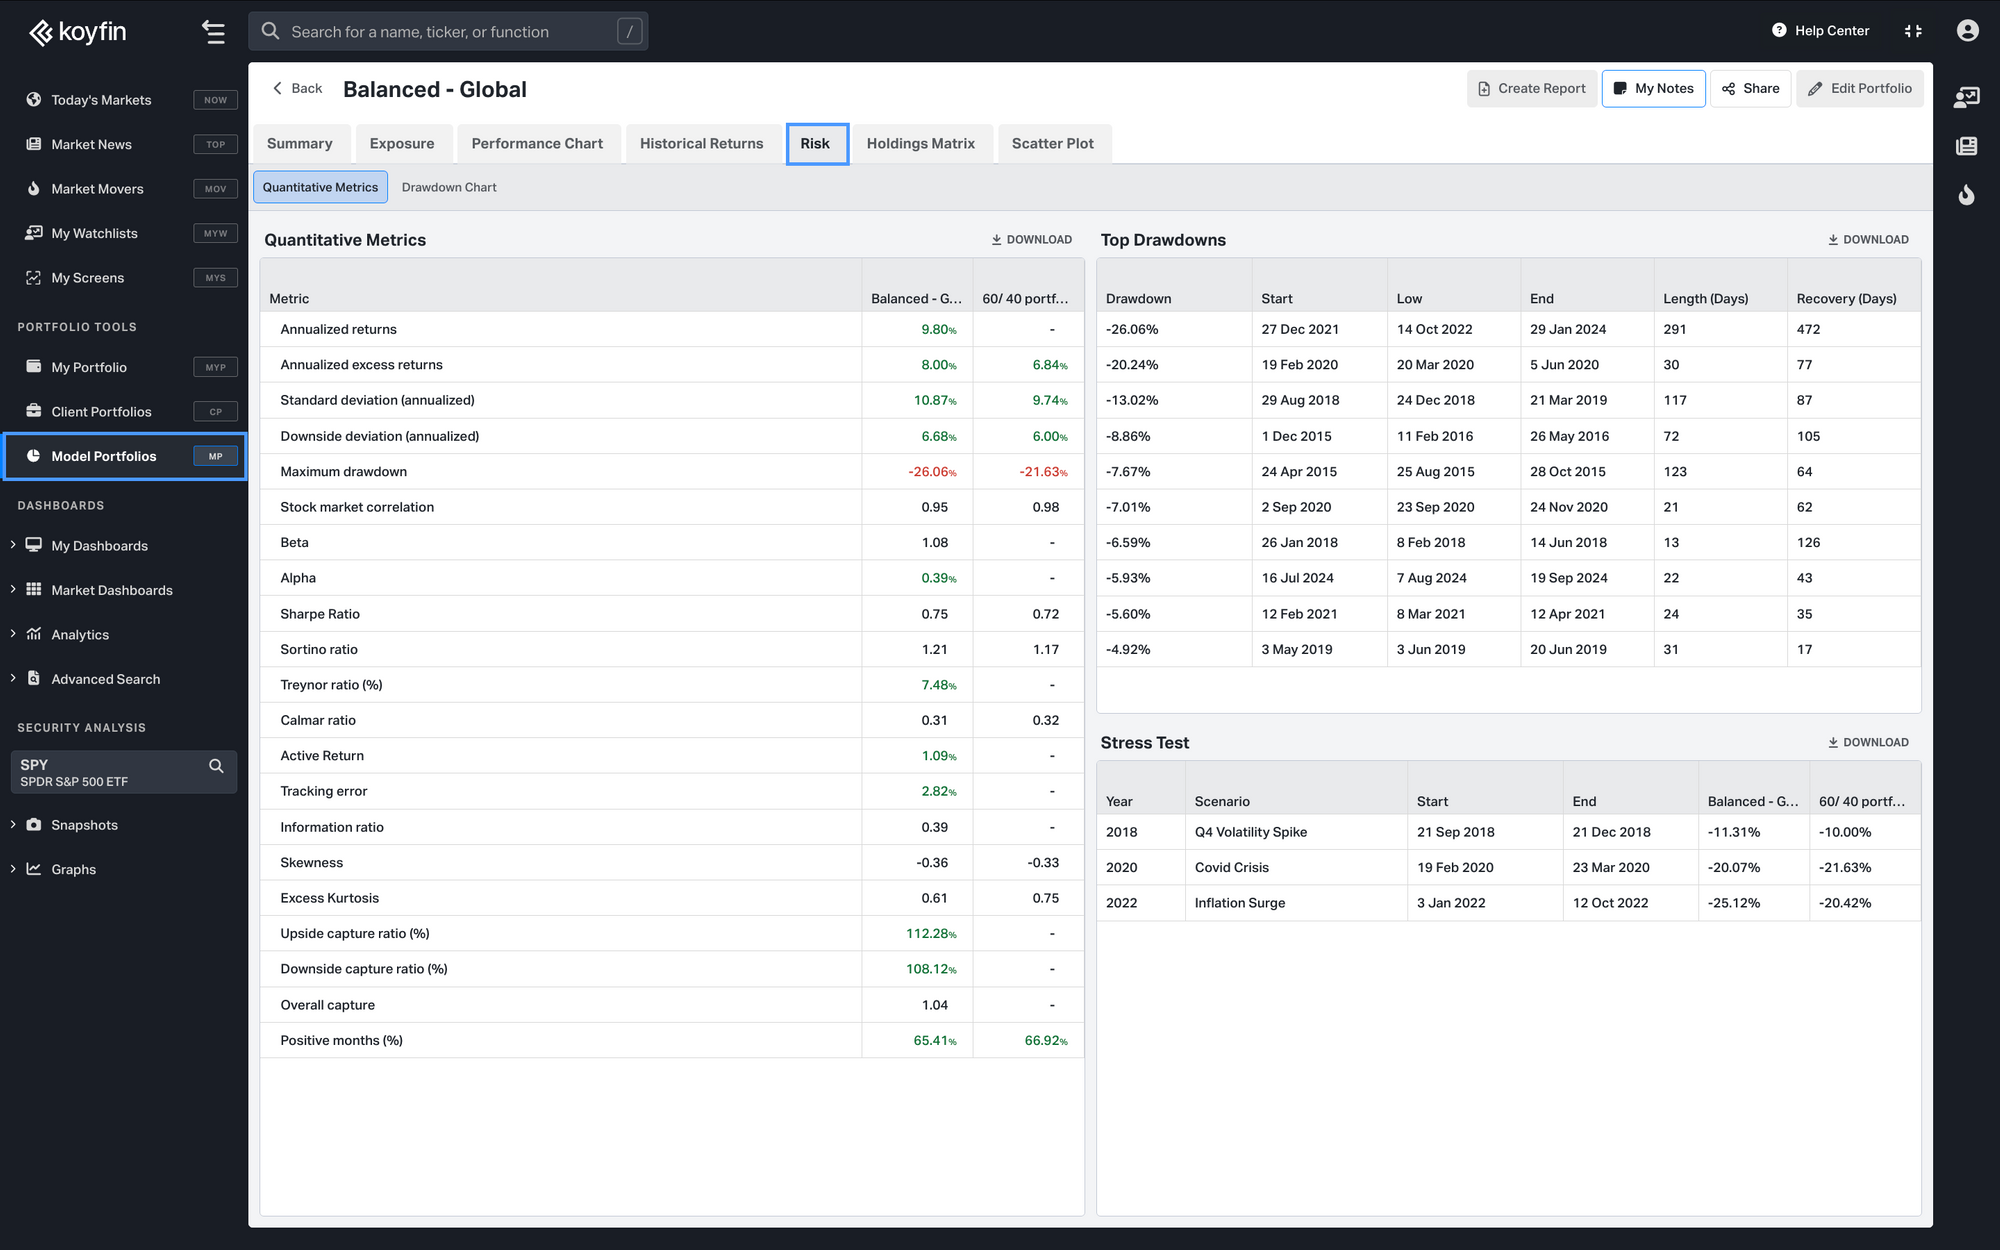
The Risk Metrics snapshot allows you to assess risk from many different perspectives. See the largest historical drawdowns and how the portfolio performed in specific stress tests.
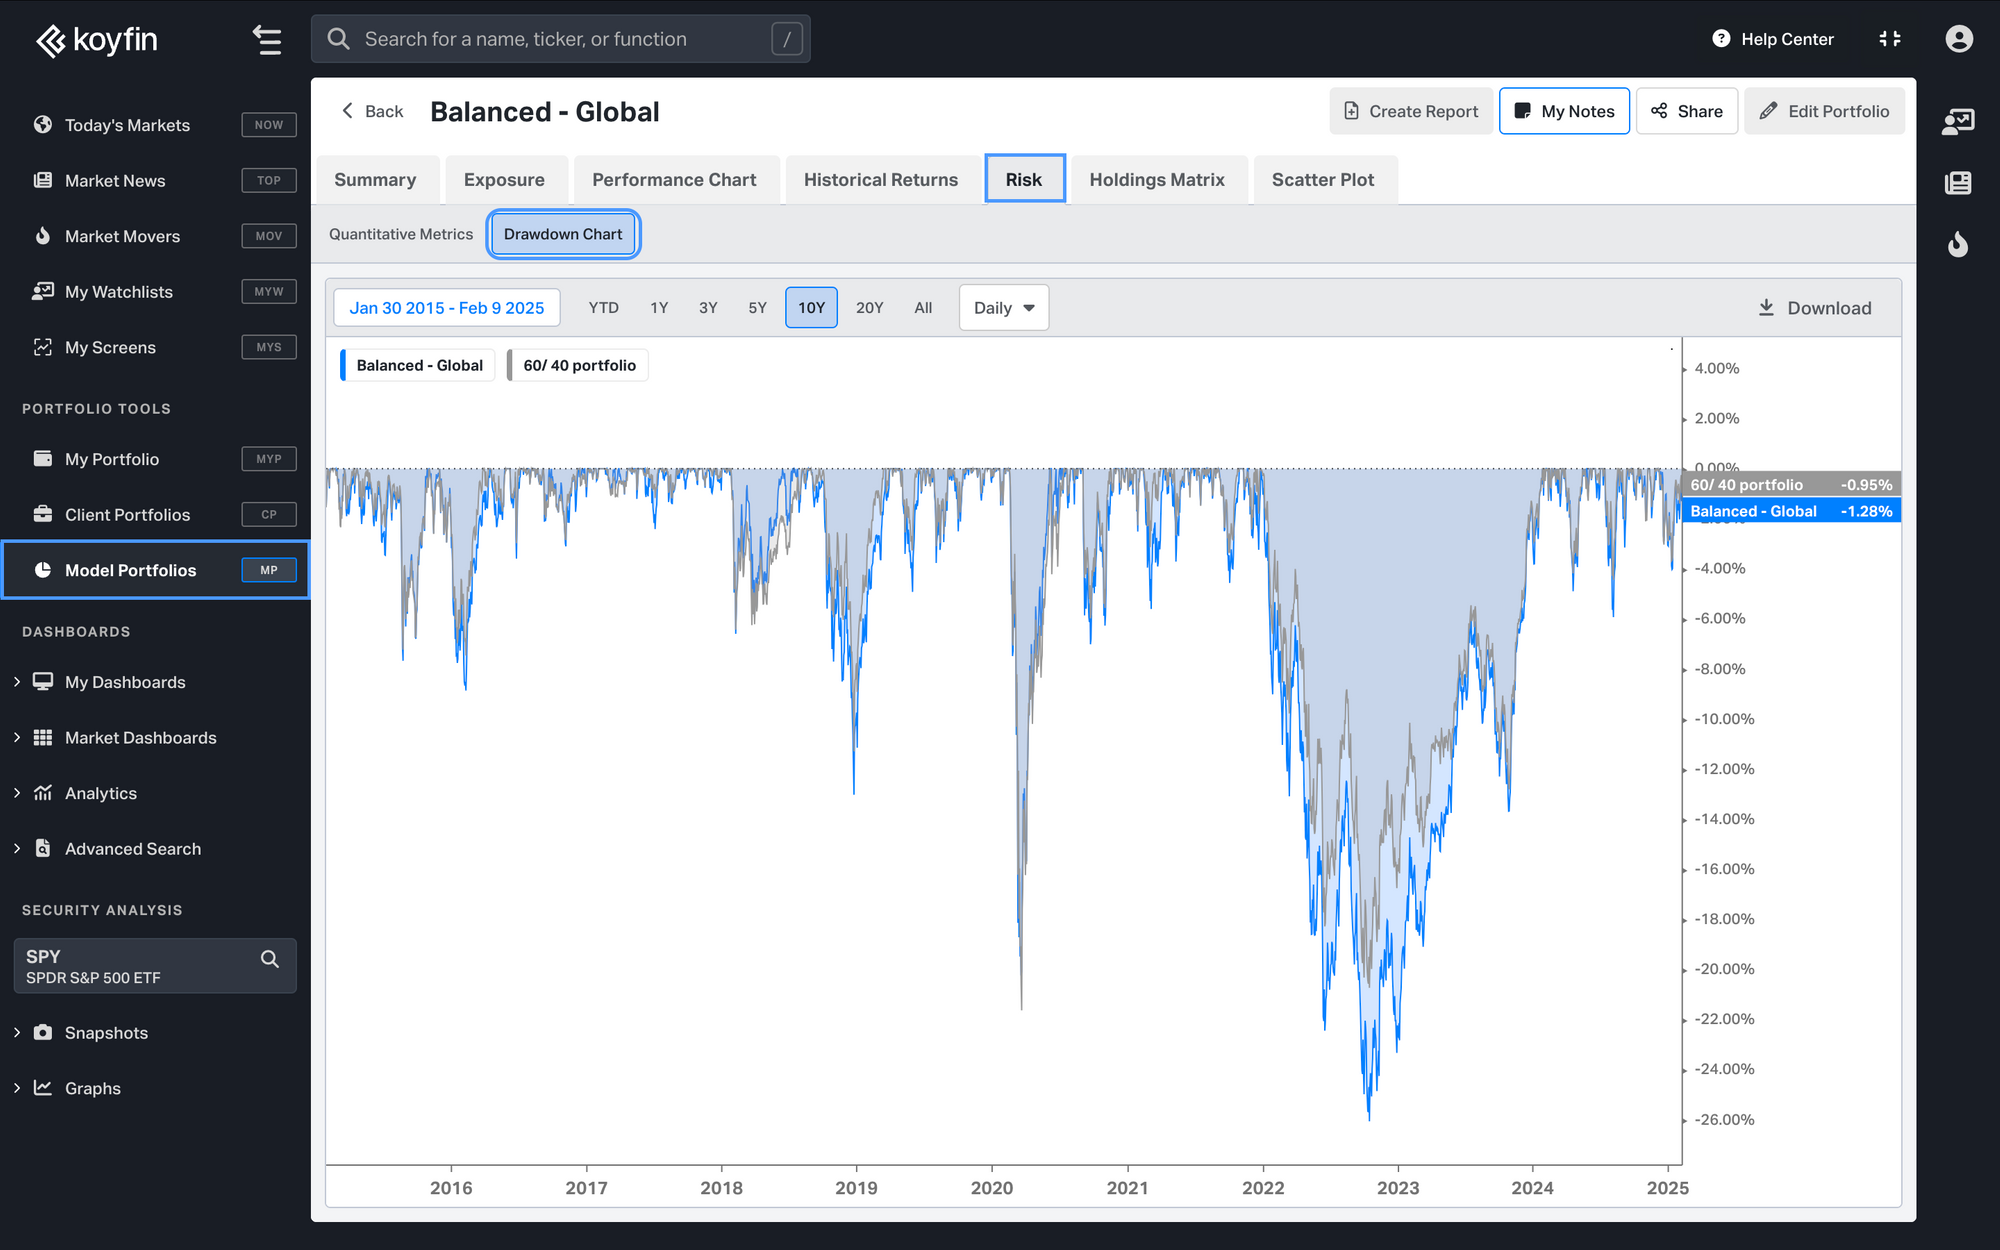
The Drawdown Chart in Model Portfolios tracks declines from peak value, helping you assess risk and recovery. Compare portfolio performance over time to refine your strategy.
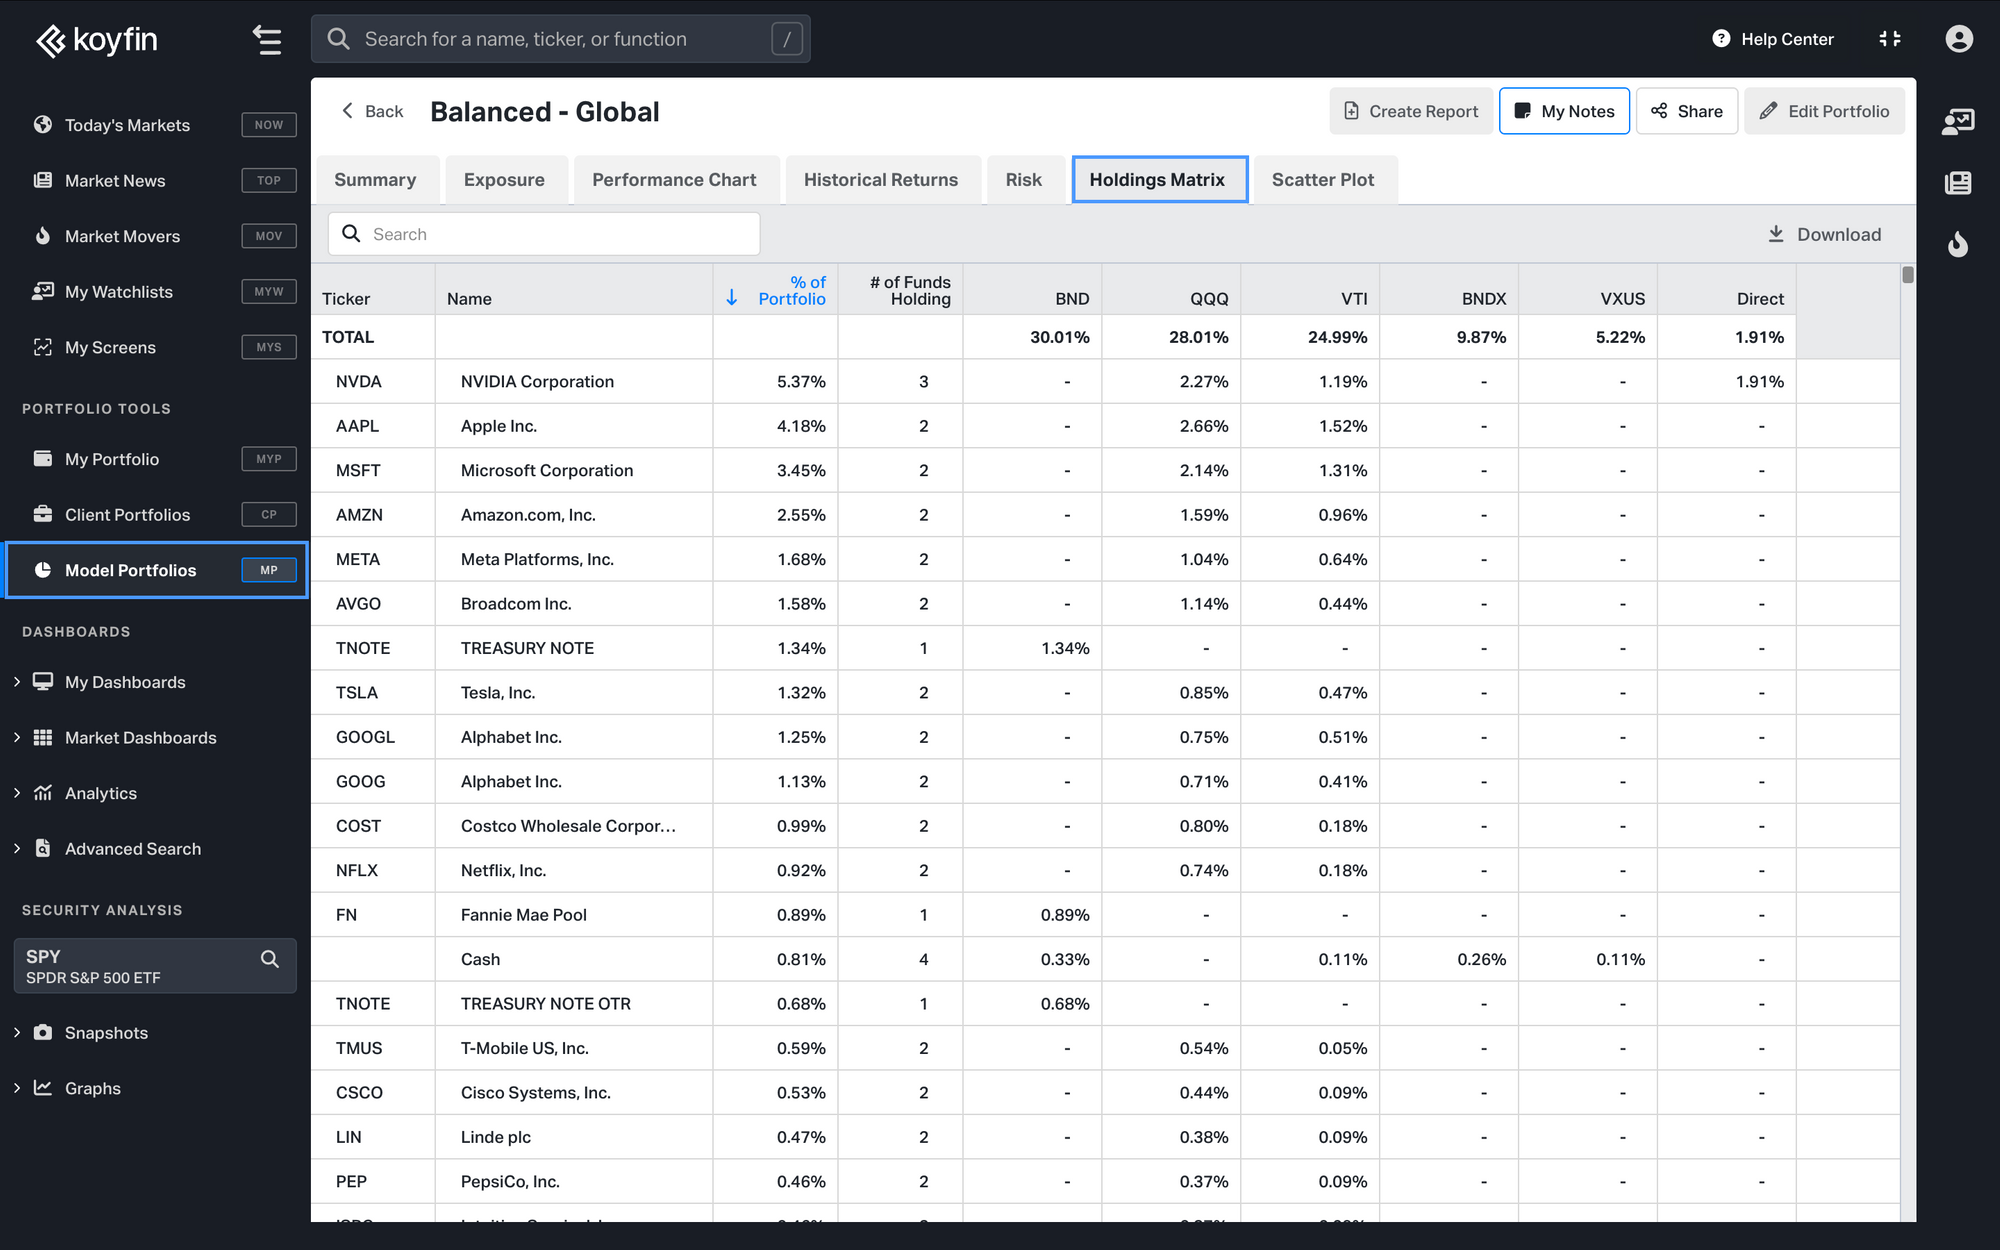
Holdings Matrix helps you identify overlap between underlying holdings by viewing how much of each security is held within a portfolio, both directly and through fund exposure.
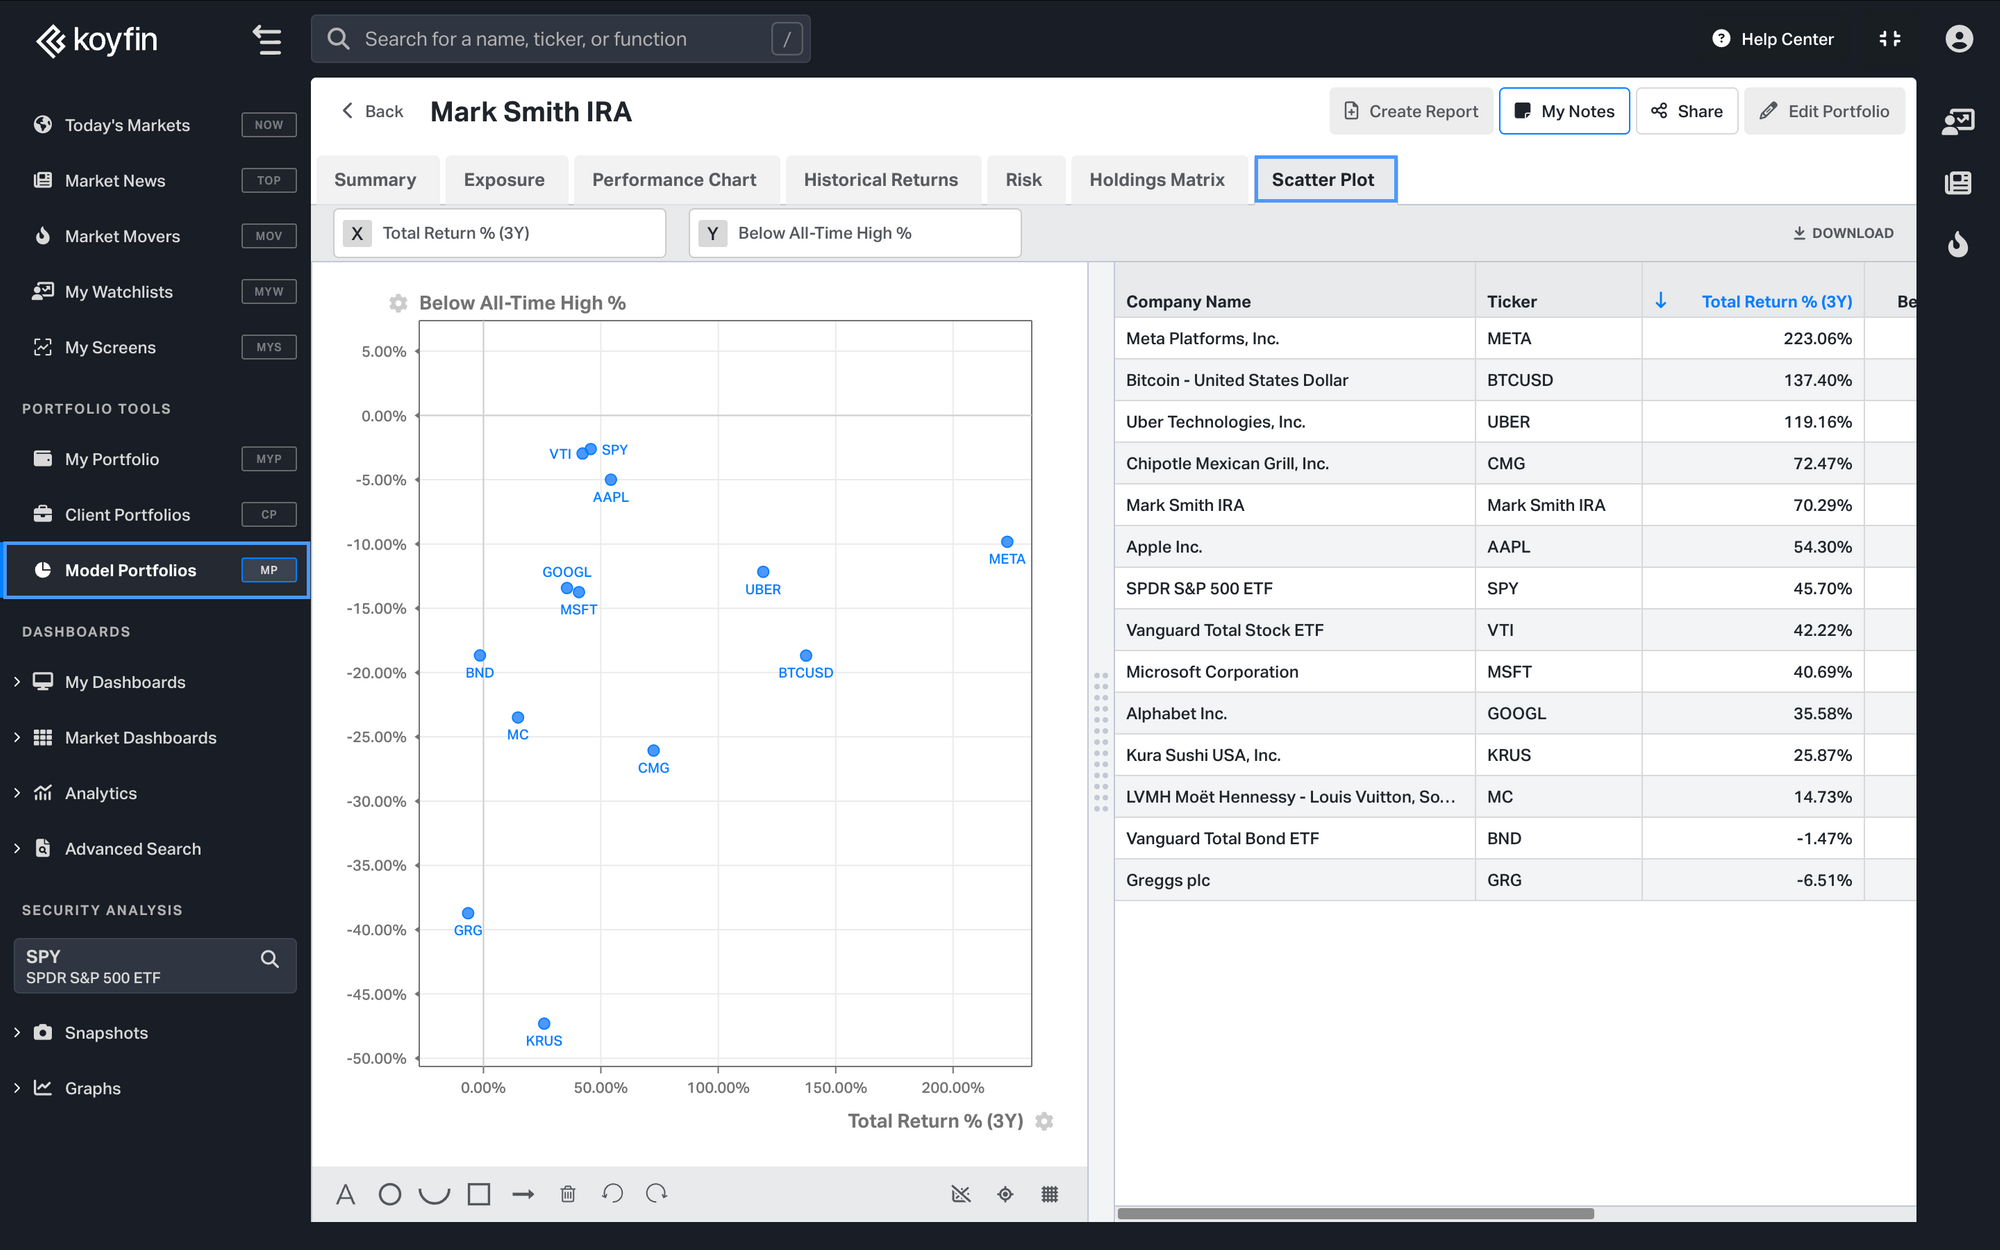
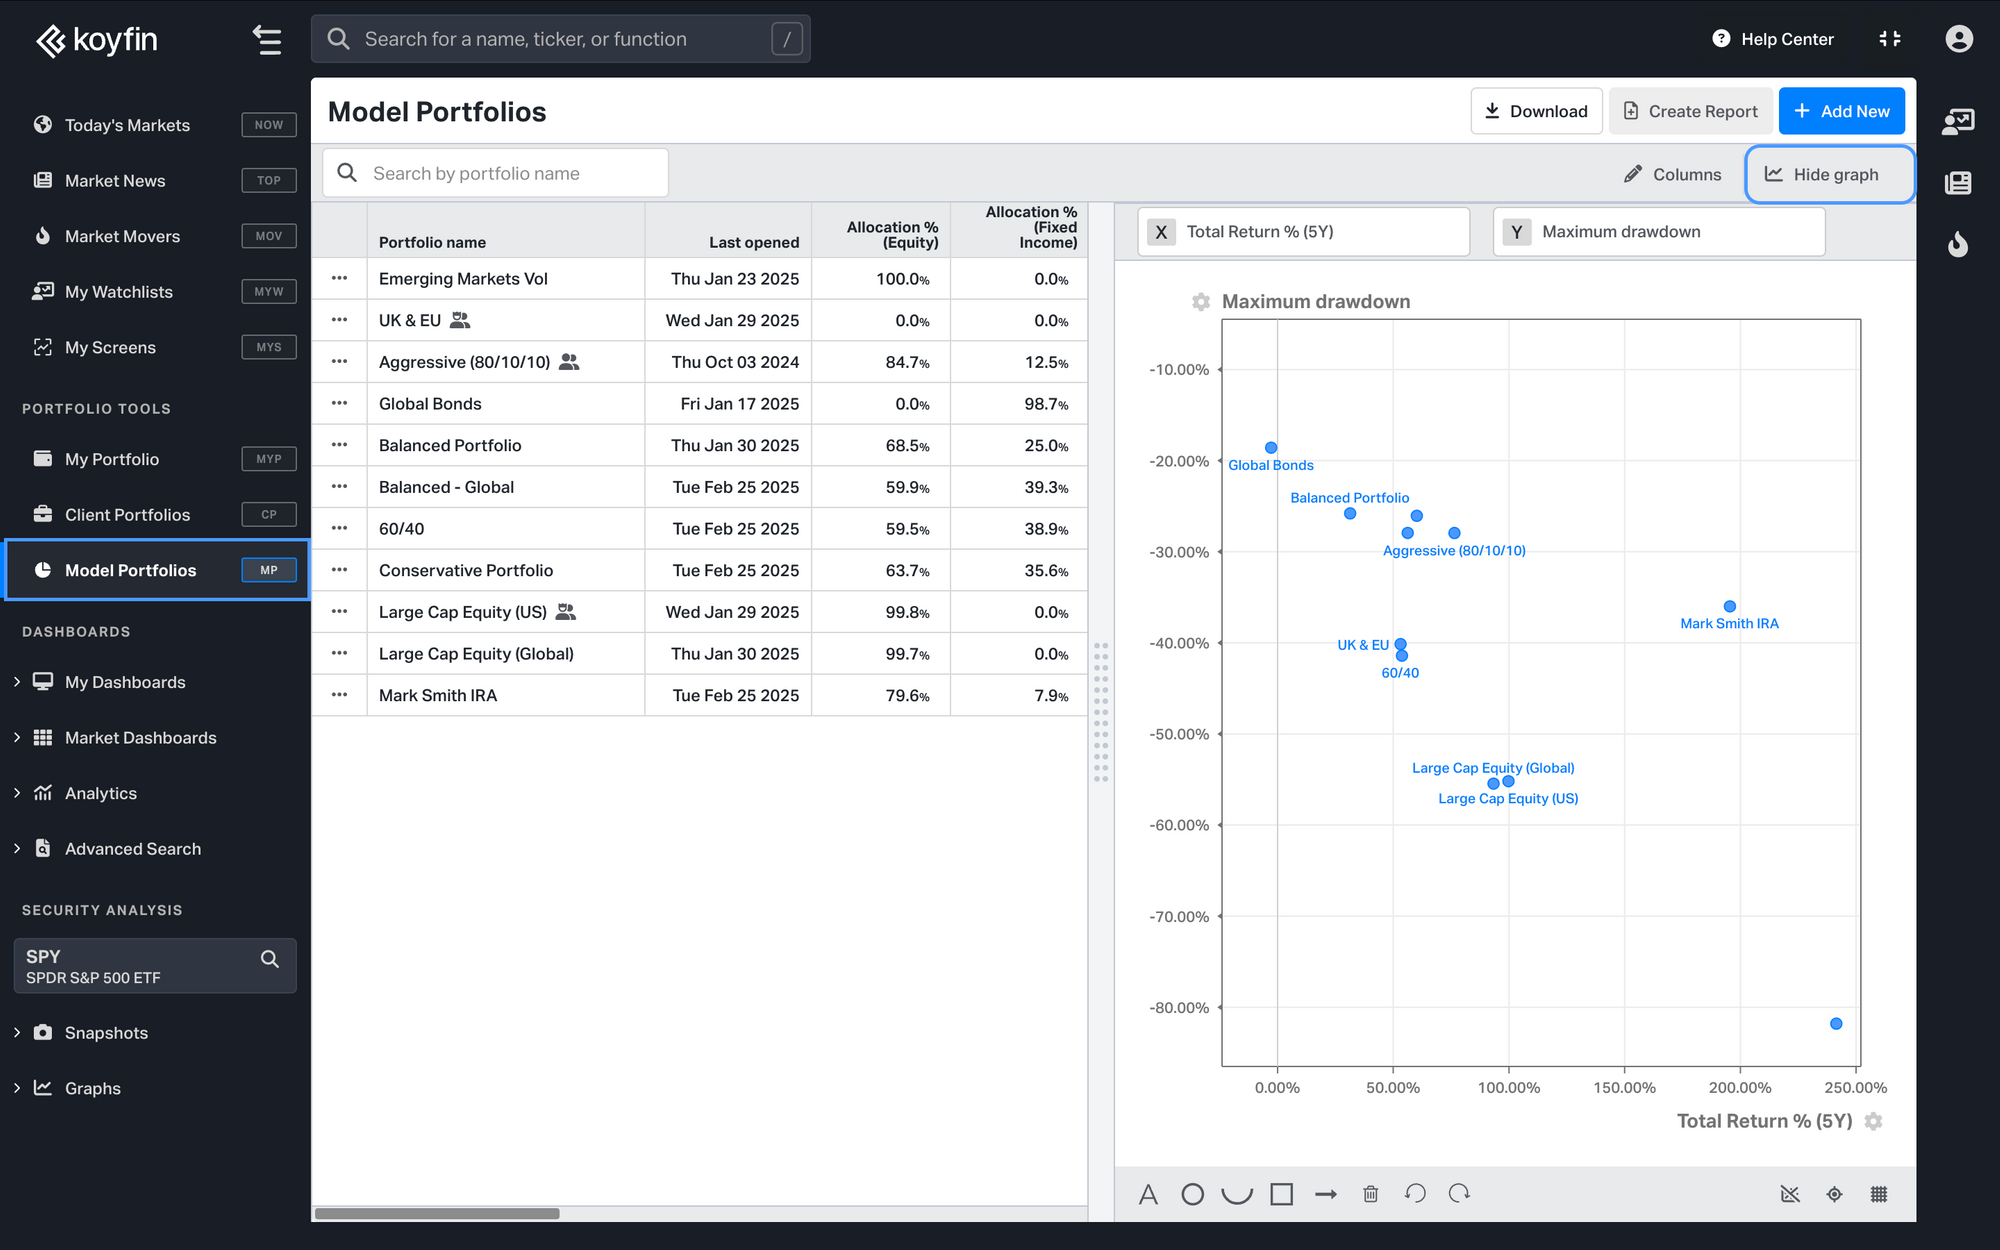
The Scatter Plot tab in Model Portfolios helps you visually compare holdings. It plots direct holdings, the overall portfolio as a single data point, and an optional benchmark for easy comparison. Customize X and Y axes to focus on key metrics, and use the accompanying table for a more detailed breakdown.
Portfolio Settings
Portfolio Currency: Set your preferred portfolio currency. Our portfolio builder captures how currency affects investing in foreign securities.
Start Date: Select a starting month for your portfolio’s inception. Note that the portfolio will use the latest close prices as of the trading day prior to this month as its starting point. Selecting June 2020 as the starting month will pull holdings prices as of the close of market on May 31st, 2020. This ensures the portfolio’s performance history starts on June 1st, 2020.
Benchmark: Choose an ETF, Mutual Fund or model portfolios as a benchmark against which to compare your portfolio's risk and performance. Portfolio snapshots show portfolio performance and risk metrics compared to the benchmark.
Rebalancing Frequency: Periodic rebalancing options ensure that your asset mix stays aligned with your investment goals. The portfolio can be rebalanced daily, monthly, quarterly, annually, or have no rebalancing.
Advisor Fees: You can set the annual fee amount and collection frequency. If you choose 1% quarterly that means that the portfolio performance will decline by 0.25% on the last trading day of each quarter, representing the fee.
Initial Value: Set a portfolio initial value to view the notional value of gains and losses over time.
Custom Rebalancing
Custom rebalancing offers you even more granular control over your investment strategy. Set periodic rebalancing or create bespoke allocations to your Model Portfolio holdings and target weights.
Select the “Rebalance Date” to add a new column of target weights. On the selected date the rebalance will occur after hours using the close prices on that day. Remember that you can use 0% weight to completely reconstruct the portfolio in addition to modifying weights for existing holdings.

Additional Functionality
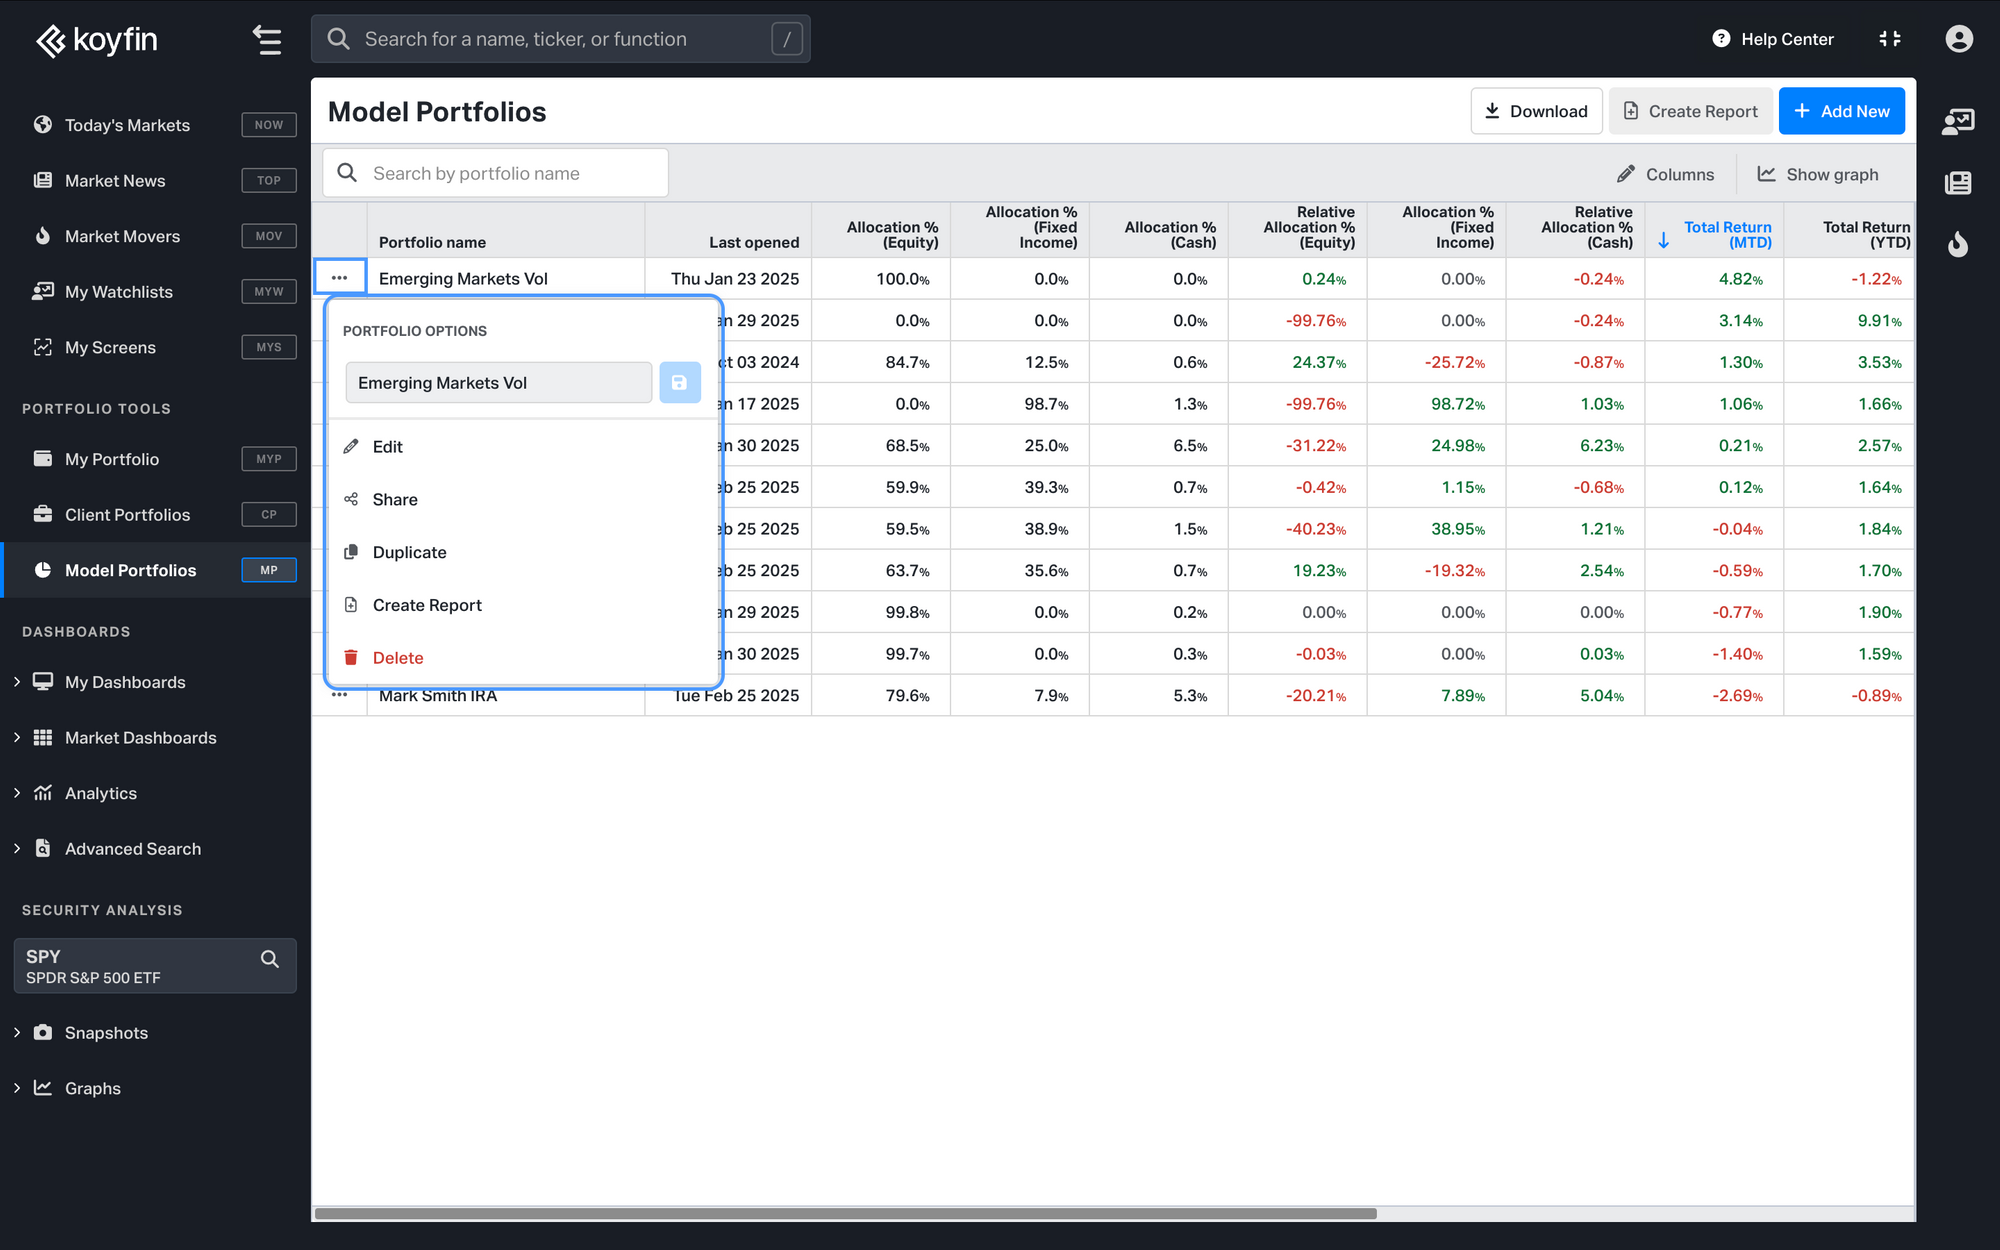
Below is the home page for viewing, managing, and comparing Model Portfolios. Click on horizontal ellipse ("…") in the table to edit, share, duplicate, create report, delete or rename a portfolio.
On the Model Portfolio homepage, click "Show Graph" in the top-right corner next to "Columns" to open the Scatter Plot Chart for a quick portfolio comparison. Each model portfolio appears as a single data point, and you can customize the X and Y axes to analyze key metrics, making it easier to spot trends and compare performance at a glance.
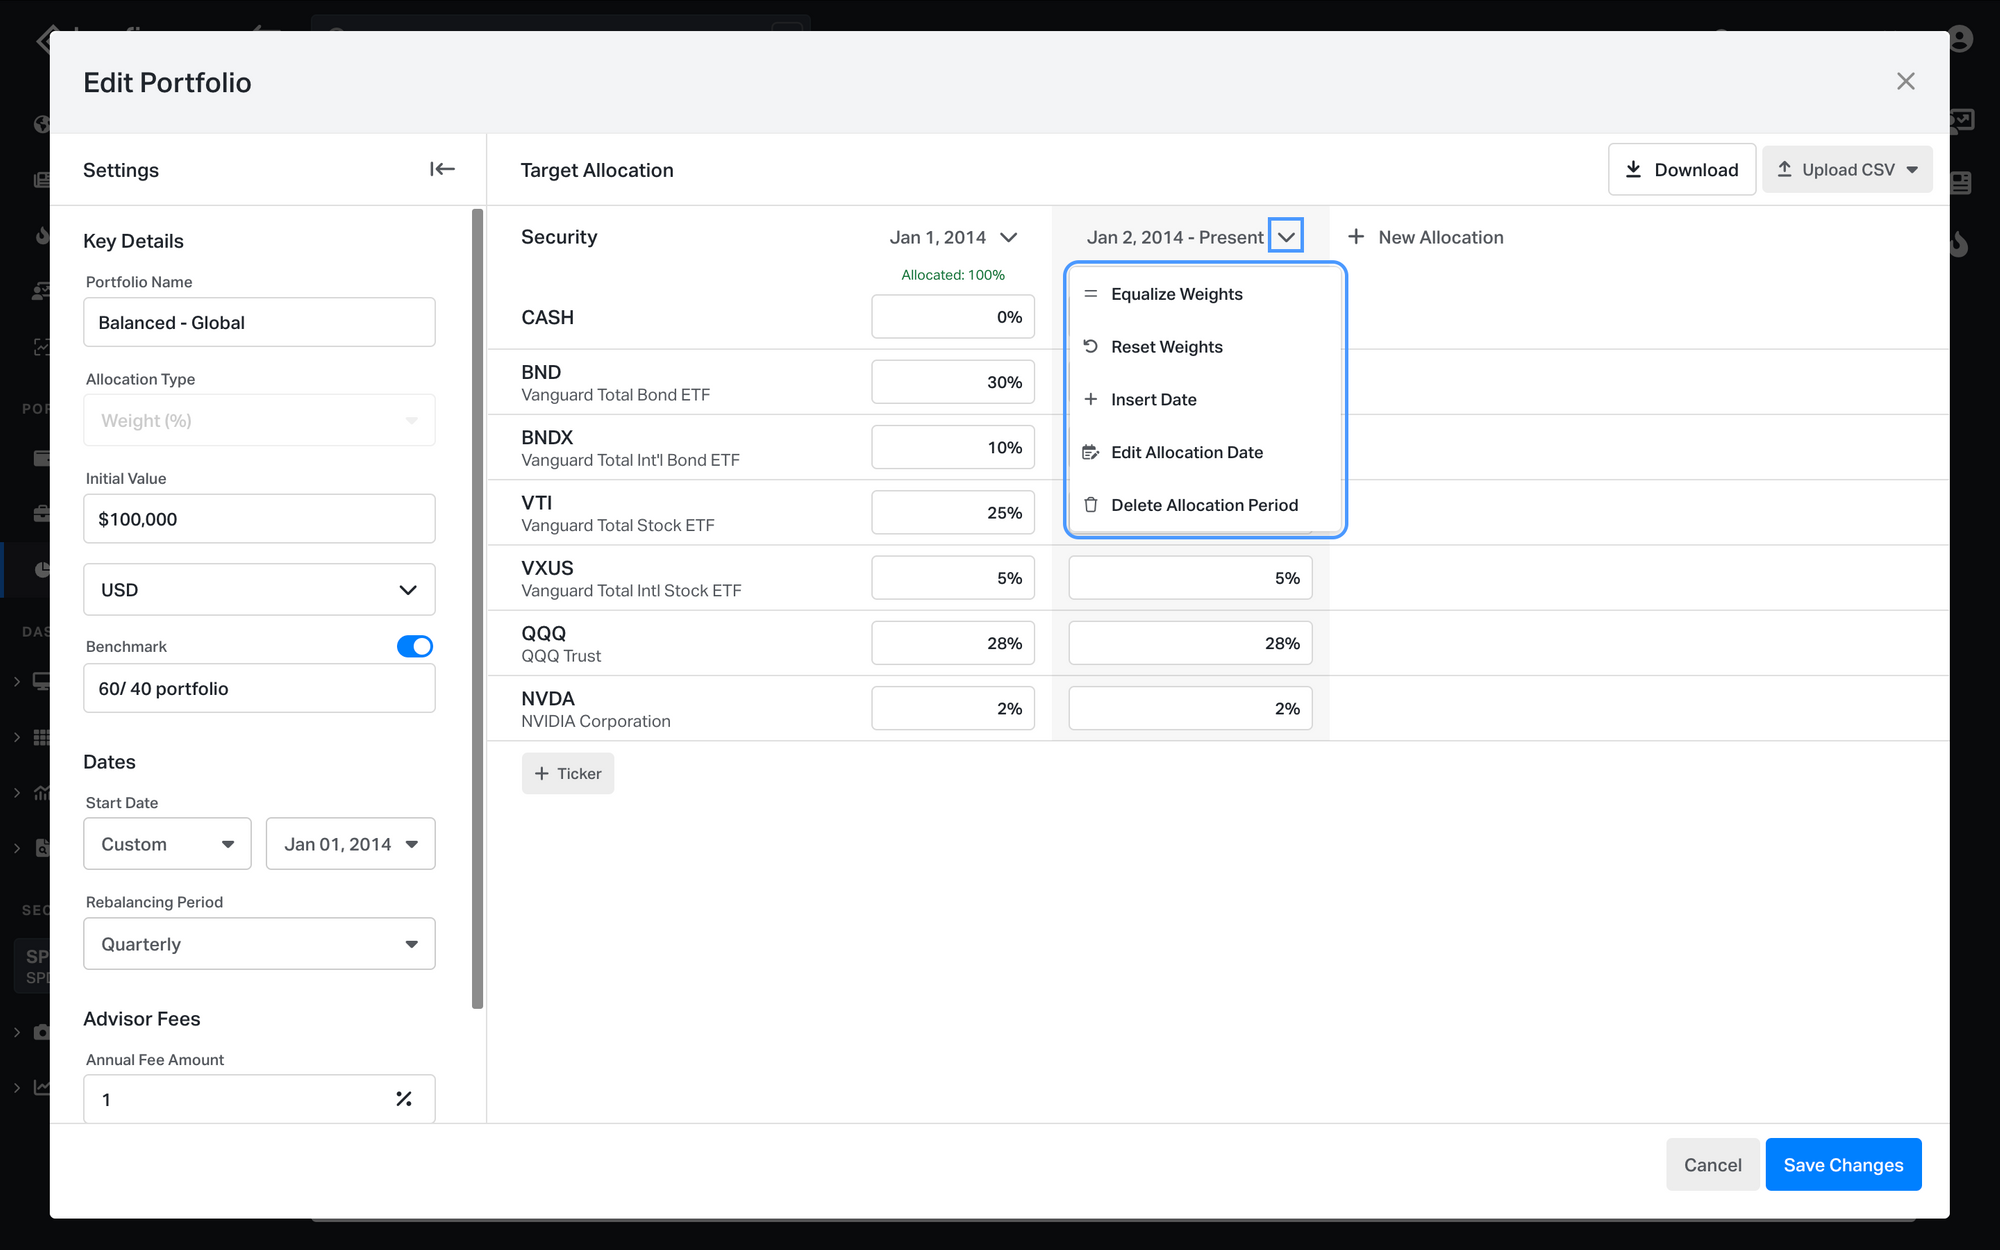
When creating or editing a portfolio, click on the date heading menu to…
- Equal weight each position
- Reset all weights to 0
- Insert date
- Change the custom allocation date (if the column is a custom allocation)
- Remove the allocation period
Positions that IPO after the Portfolio Starts
If a holding incepts (IPOs) after the Portfolio Start date then the UI will give you a warning message with the date when the holding began trading (e.g. April 11th, 2012).
You can resolve this conflict by:
- Moving the start date forward
- Adding a custom rebalance on April 11th, 2012, and allocating the weight elsewhere until the holding begins trading
Check out this video demo to see how to get the most out of Model Portfolios: