We've introduced new features to enhance your Koyfin experience. Take a look:
- Fund Exposure Snapshot
- Charts: Constant valuation multiples
- Charts: Volume by price
- Charts: Fibonacci extensions
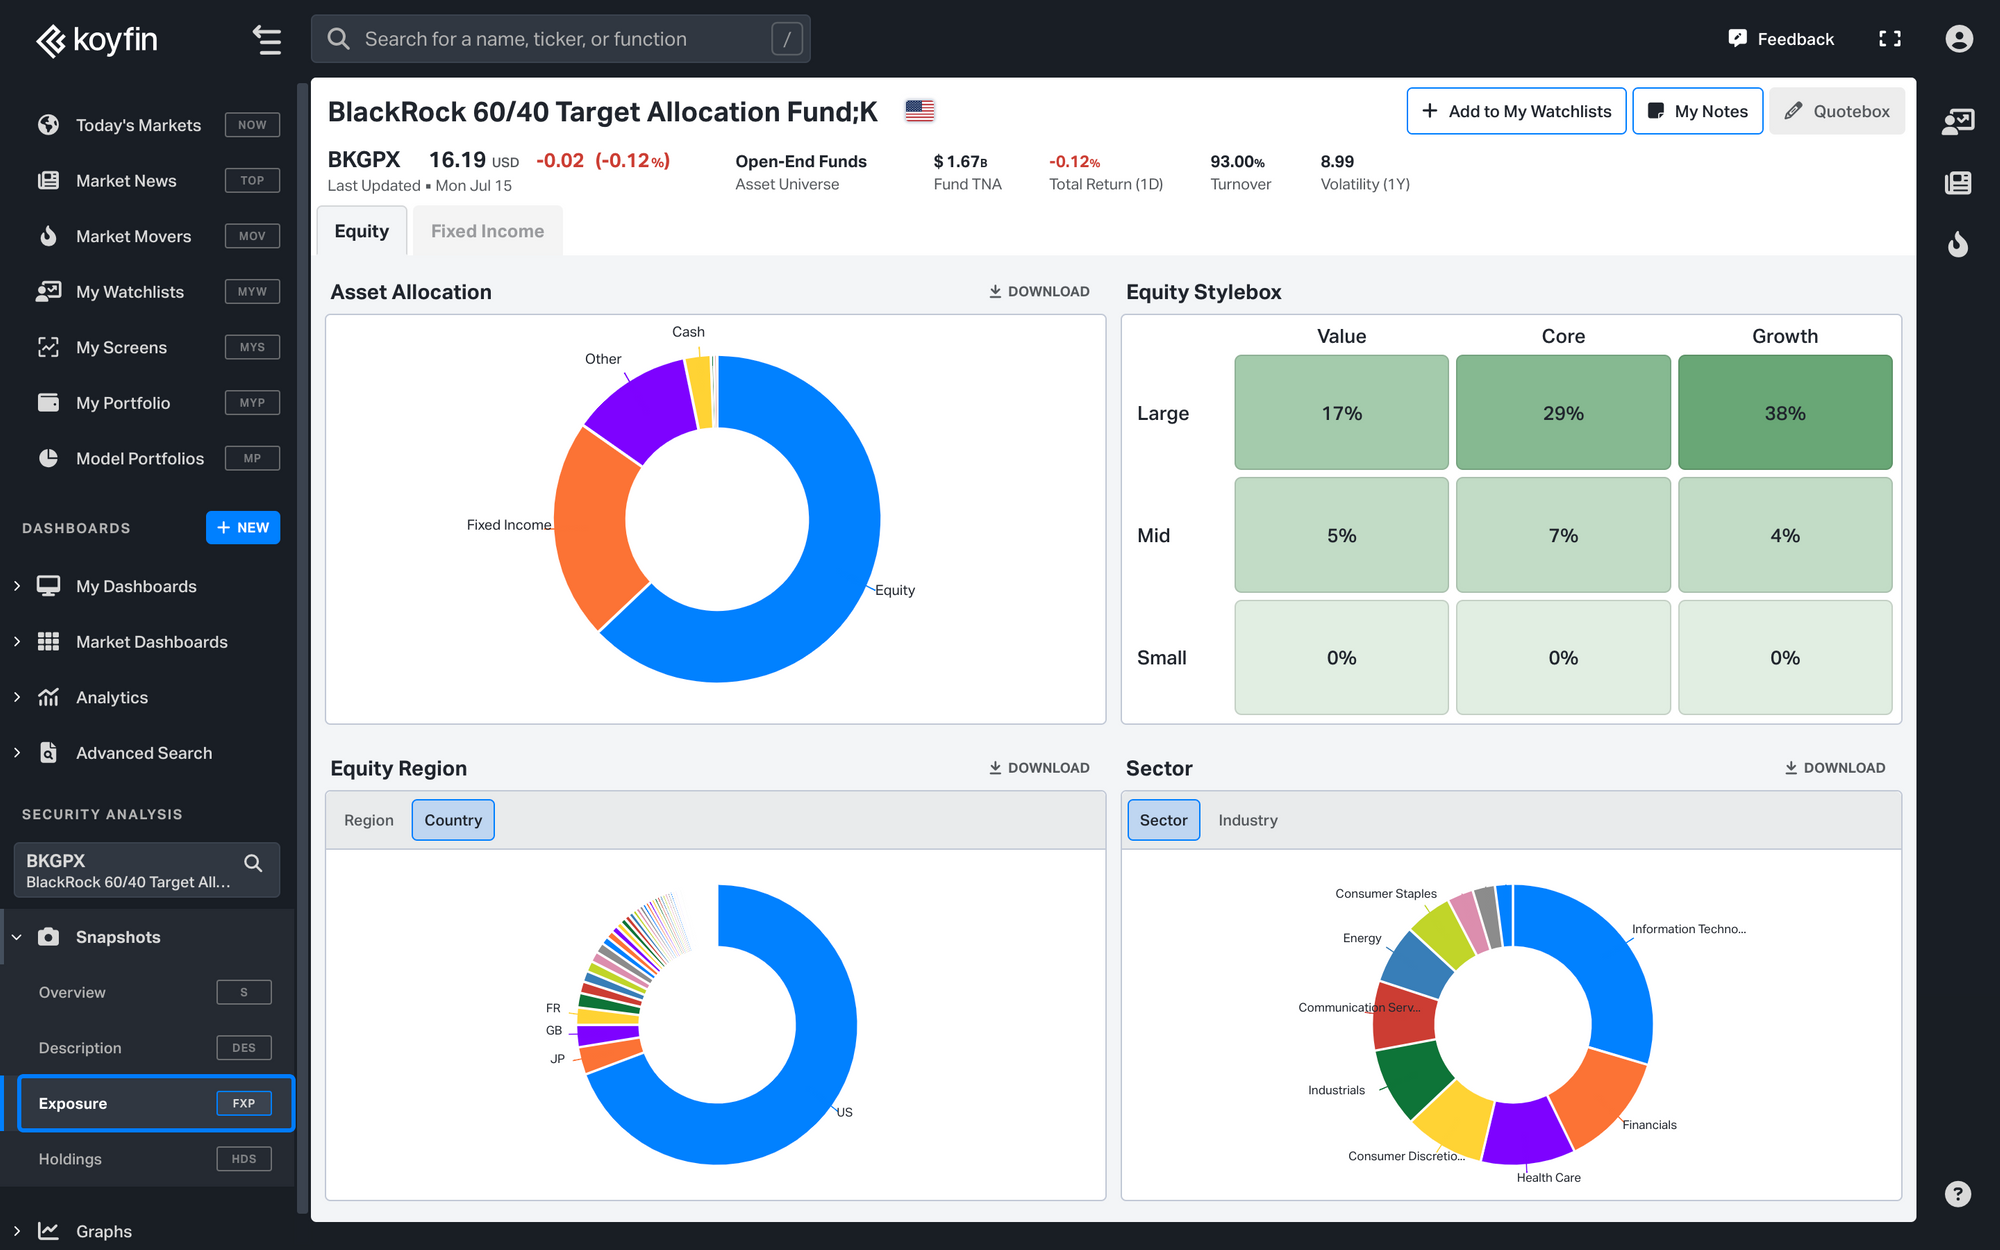
1. Fund Exposure Snapshot
We're excited to introduce Exposure, a new snapshot for ETFs, mutual funds, and closed-end funds in North America.
These snapshots provide detailed insights into the funds' equity and fixed-income exposures, including:
- Asset allocation
- Country exposure
- Sector & industry breakdowns
- Maturity & credit quality breakdowns
- Style boxes for equity & fixed-income buckets
Learn more about the new snapshot in our video demo.
Note: Fund Exposure Snapshot is only available for ETFs, mutual funds, and closed-end fund securities and is an exclusive feature of the Pro plan.
Explore our new snapshot here.
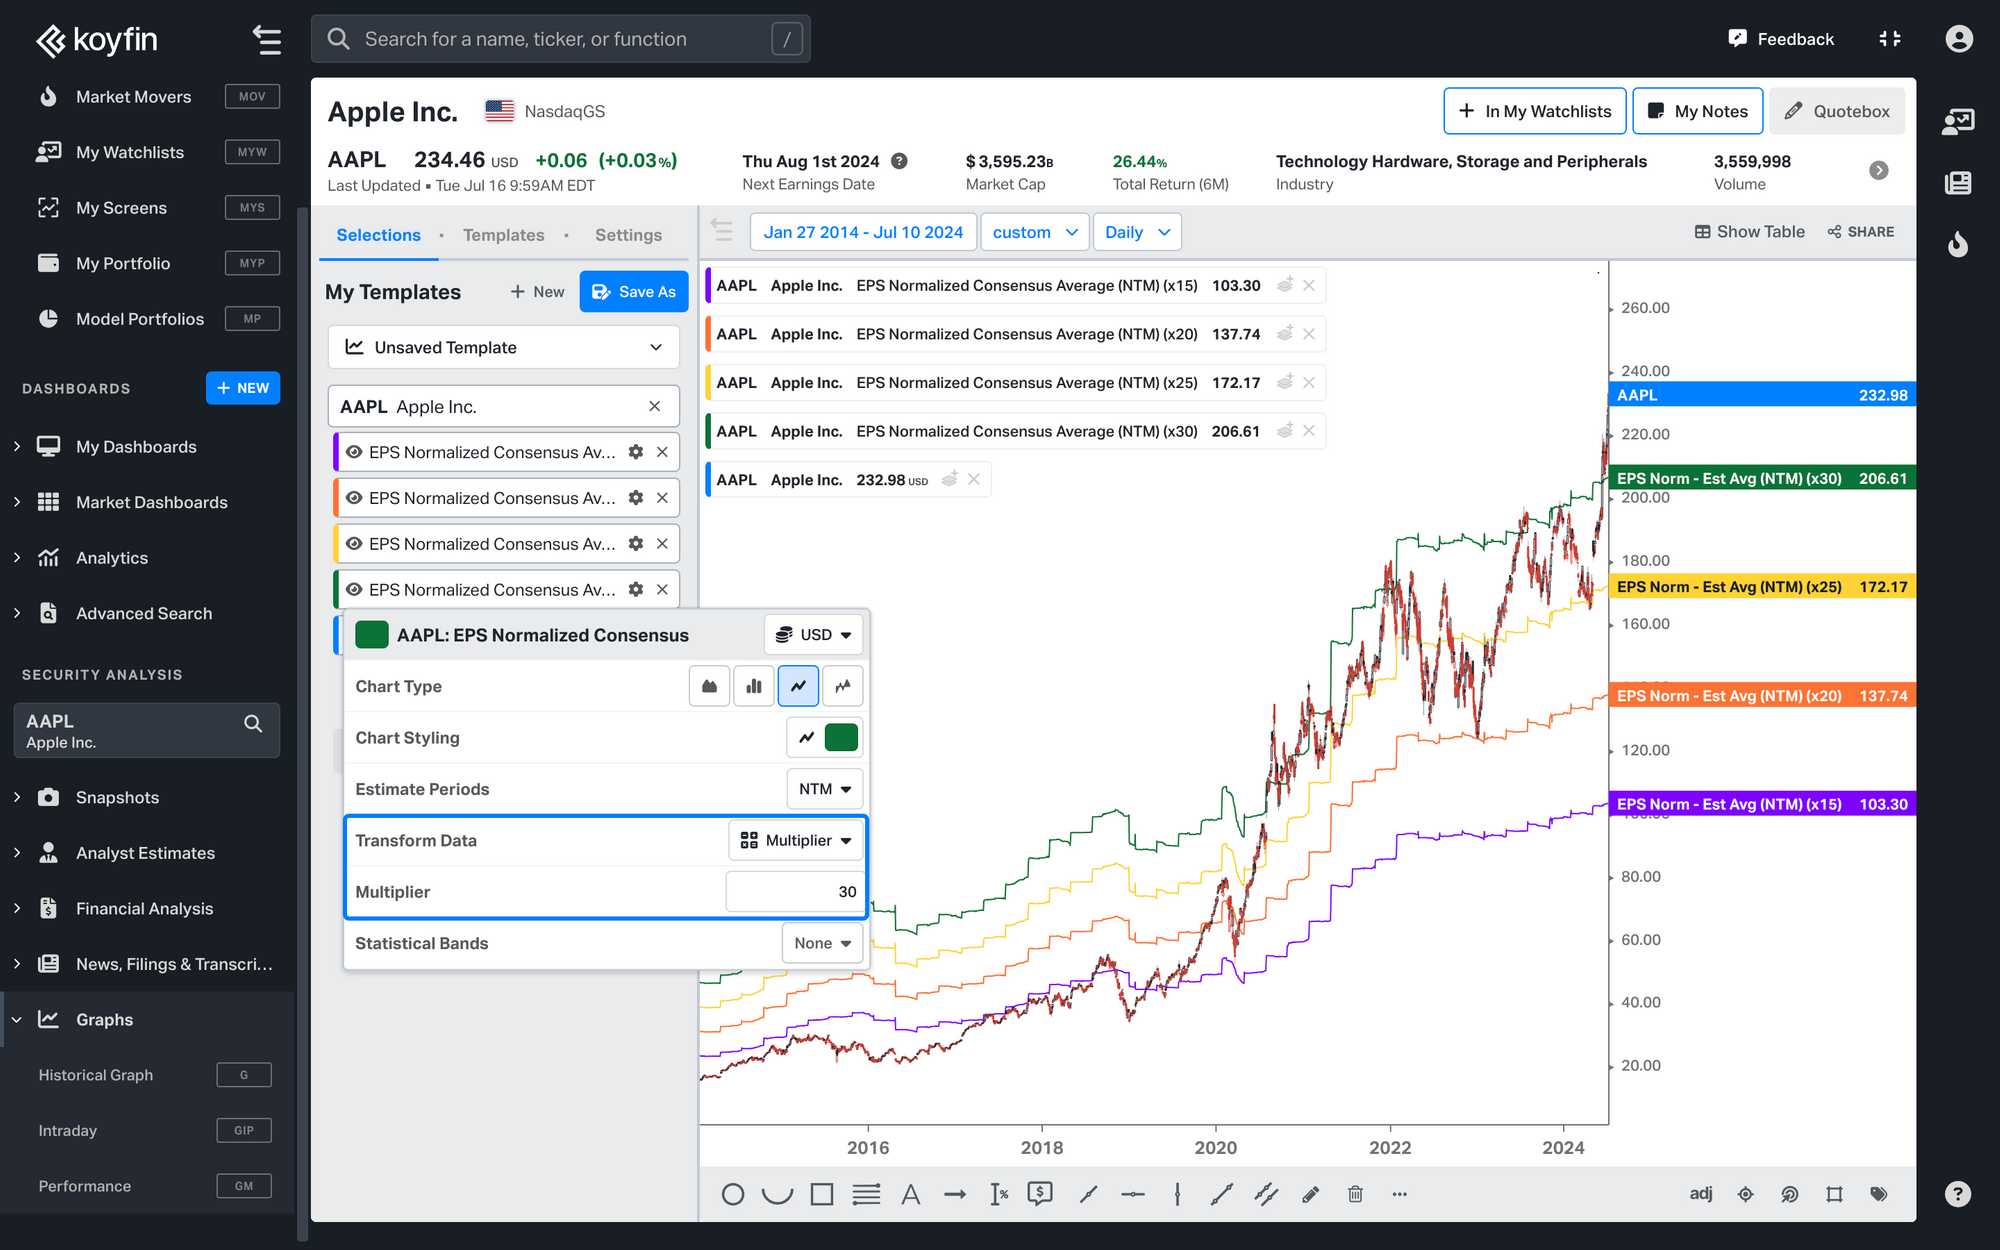
2. Charts: Constant valuation multiples
With the new Multiplier graph transformation function, you can plot constant valuation multiples over time to compare a stock price vs its fair value multiple.
To apply the Multiplier transformation, add an estimates series, such as EPS Consensus Average (NTM), to a Historical graph. Click on the ⚙️ Indicator settings, select Transform data > Multiplier, and enter a number multiplier. For example, inputting 15 would show a price that reflects a constant p/e of 15x.
Check out this video demo to discover other applications of the Multiplier transformation in your analysis.
See the example graph here.
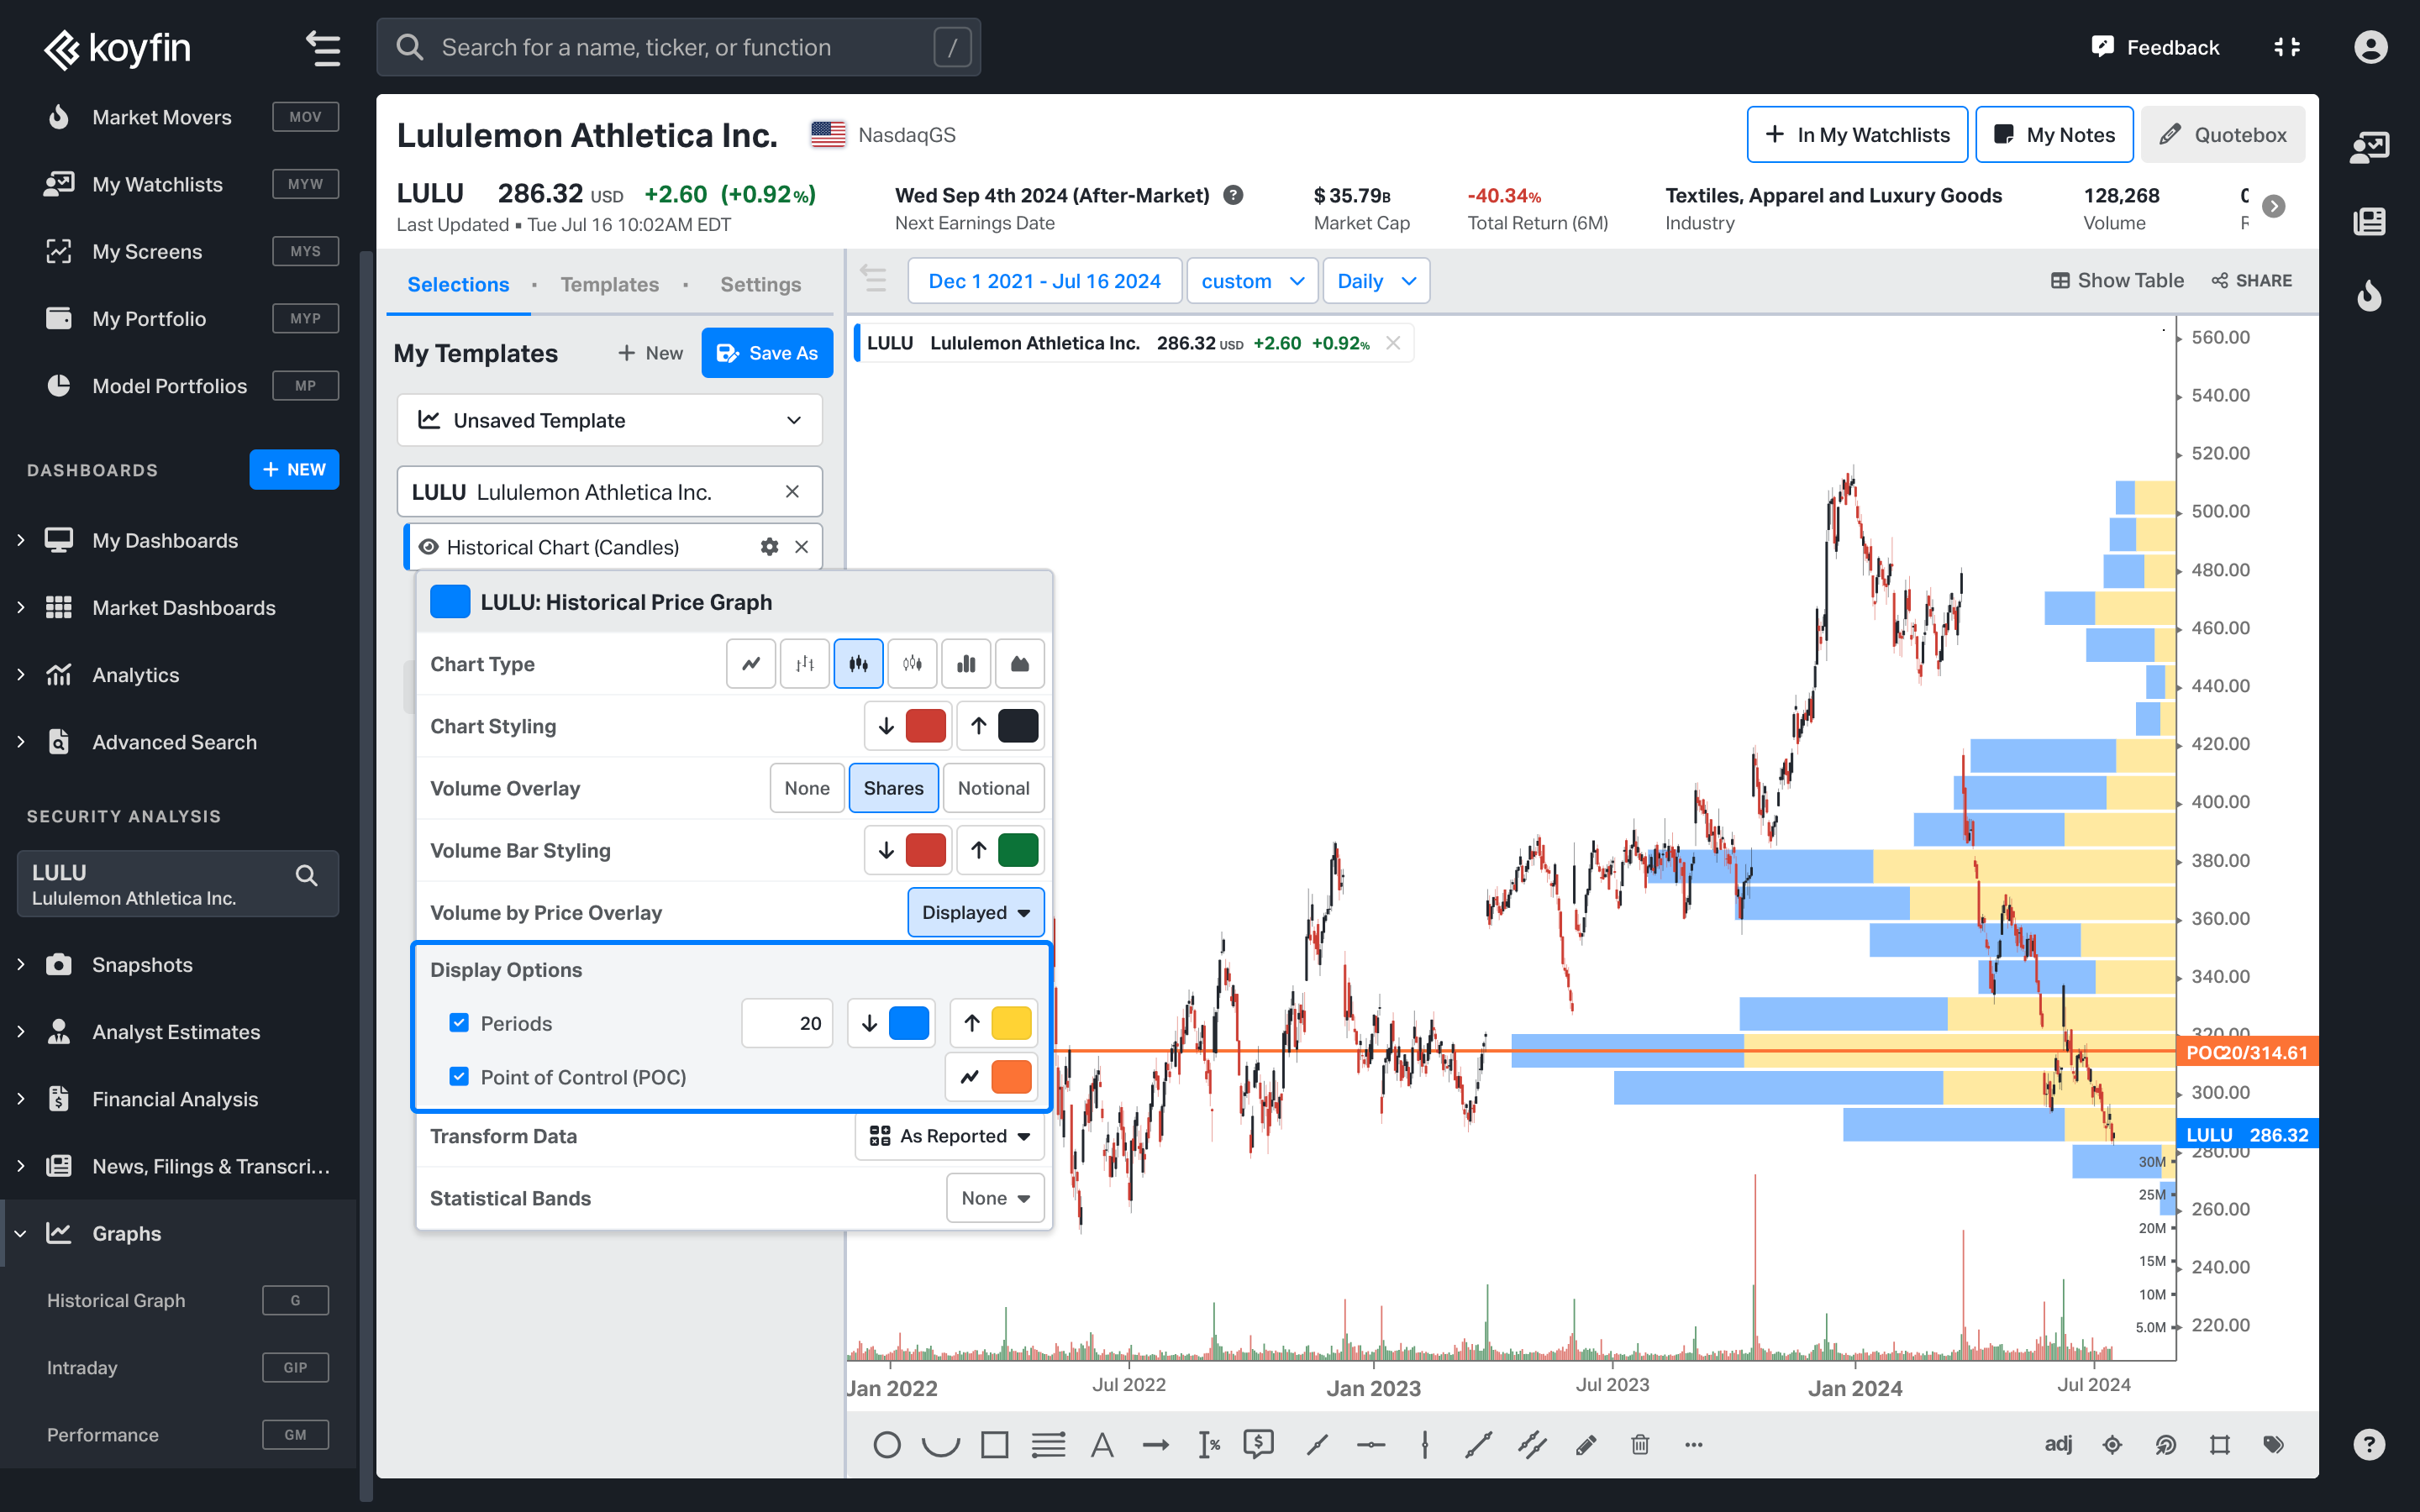
3. Charts: Volume by price
You can enhance historical price charts by adding the Volume by Price Overlay. This technical indicator is compatible with any security that has volume data, displaying the total volume traded at each price level over a selected period.
To view the Volume by Price overlay, click on the ⚙️ settings icon on the Historical Price series. Then turn on Volume by Price Overlay.
Discover more about utilizing this new overlay and its calculation method in our video demo.
Open the example graph here.
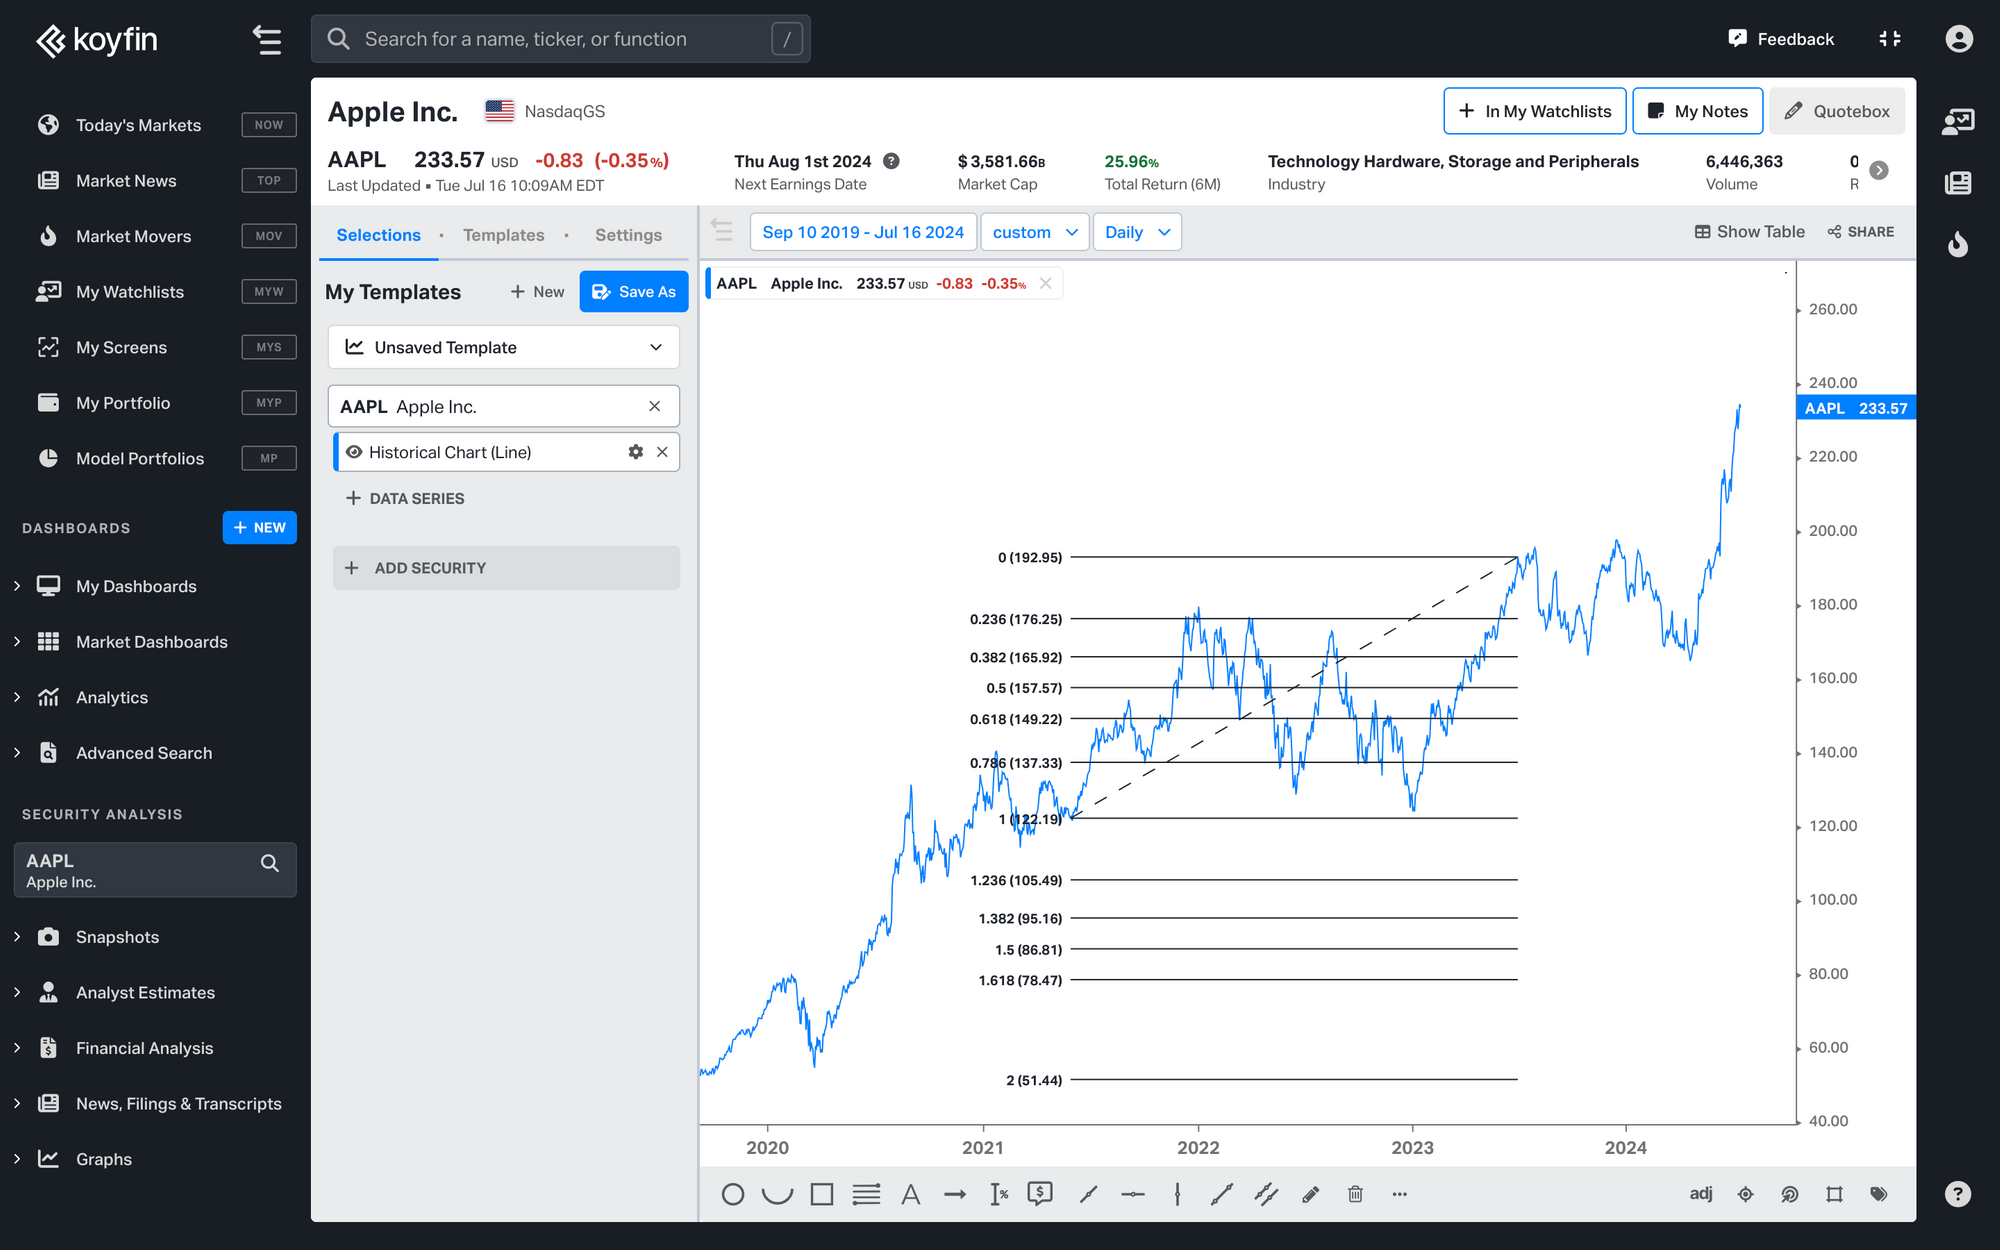
4. Charts: Fibonacci extensions
In addition to Fibonacci retracements, Koyfin now supports Fibonacci extensions and retracement trend line as part of our chart annotation tools.
These enhancements help you project potential price levels beyond standard retracements, set precise price targets, and identify key areas of resistance or support in the continuation of the trend.
Check out this example graph here.