Koyfin has introduced several enhancements to improve functionality and user experience. These updates provide deeper insights into financials, expand portfolio options, and streamline data analysis, ensuring users can make more informed investment decisions.
- My Portfolio improvements
- SBC and R&D percentages of revenues
- New holdings chart in model portfolios
- US ETF valuation graphs on mobile
- Estimates for primary warrants
- Ability to cycle through watchlists in graphs
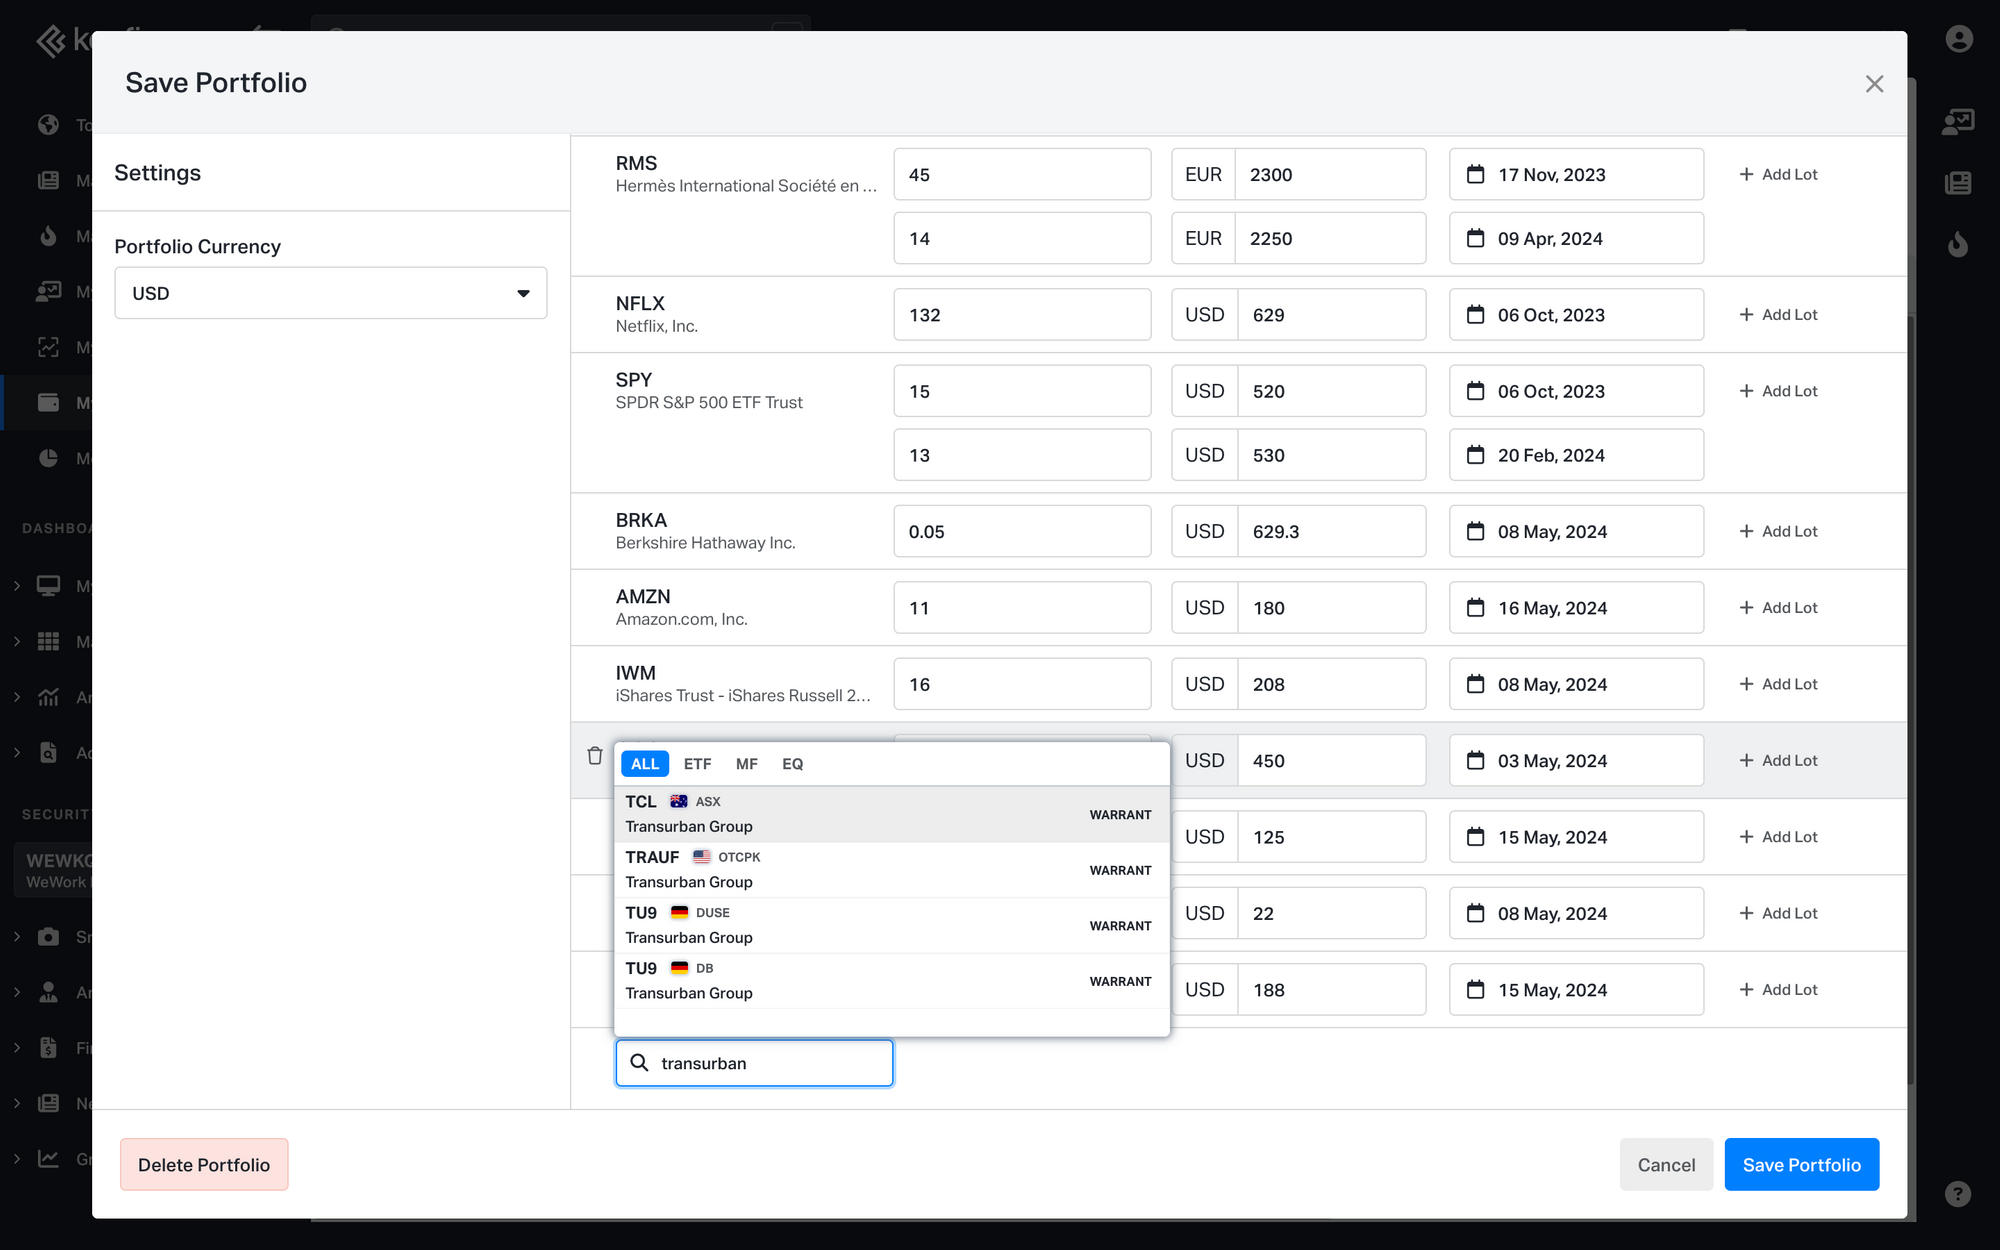
1. My Portfolio improvements
We’ve added the ability to use warrants, closed-end funds, and preferreds in My Portfolio which was a popular user request.
Another important change is the newly added 'Total Cost at Inception' column that is adjusted to your portfolio currency and is calculated by multiplying Cost * Number of Units * Current FX.
Check out these updates here.
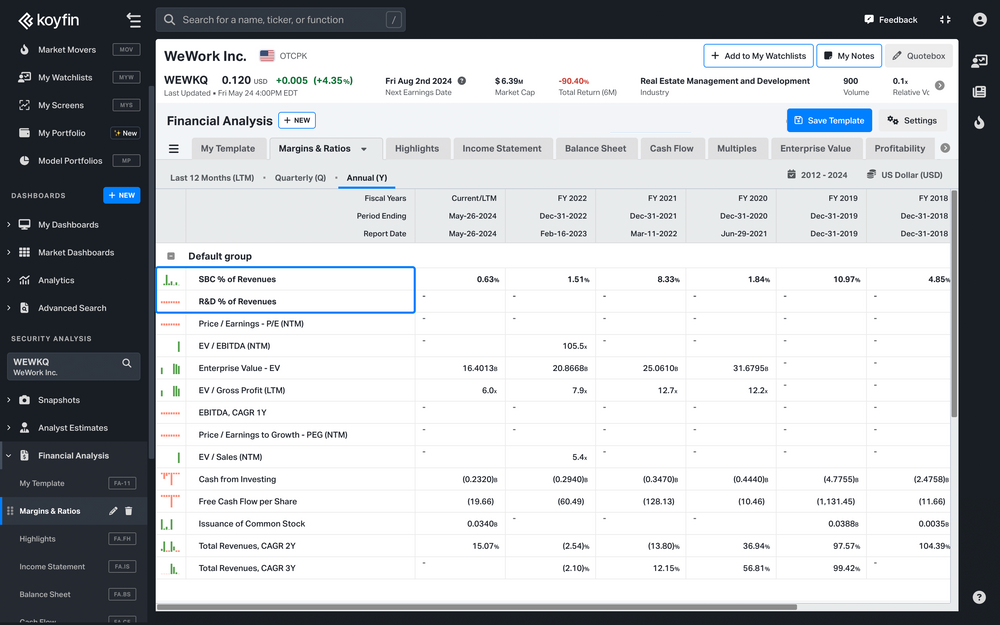
2. SBC and R&D % of Revenues
Leverage our new valuable data series — SBC (Stock-Based Compensation) % of Revenues and R&D % of Revenues — to understand the ratio to sales. These are available in watchlists, graphs, custom FA templates, and screener.
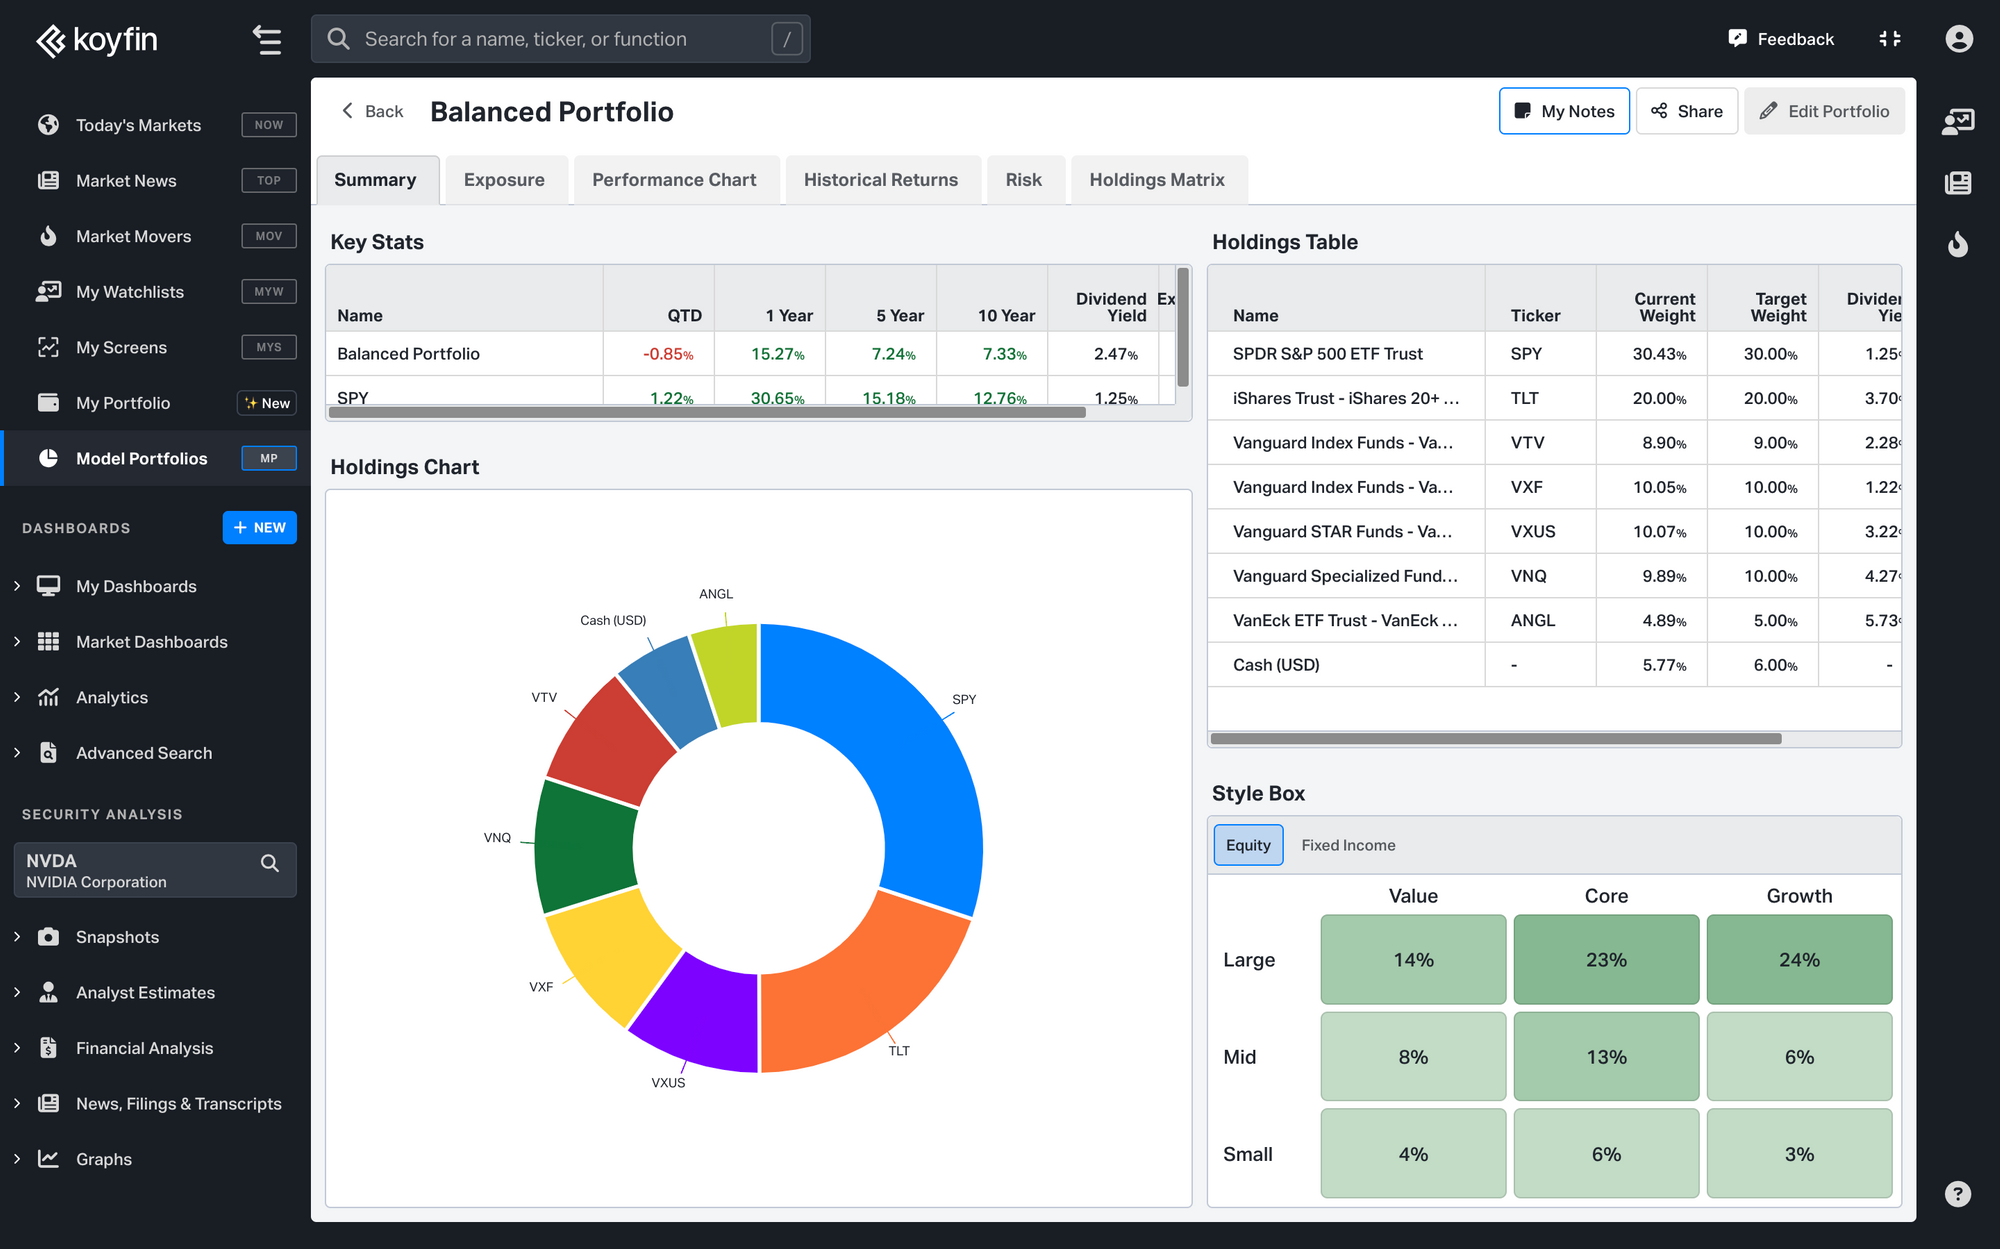
3. New Holdings Chart in Model Portfolios
As we're constantly working on refining our UI, Model Portfolios now have a new Holdings Pie Chart that allows for a cleaner and clearer data visualization, especially in bigger portfolios.
Create your Model Portfolio here.
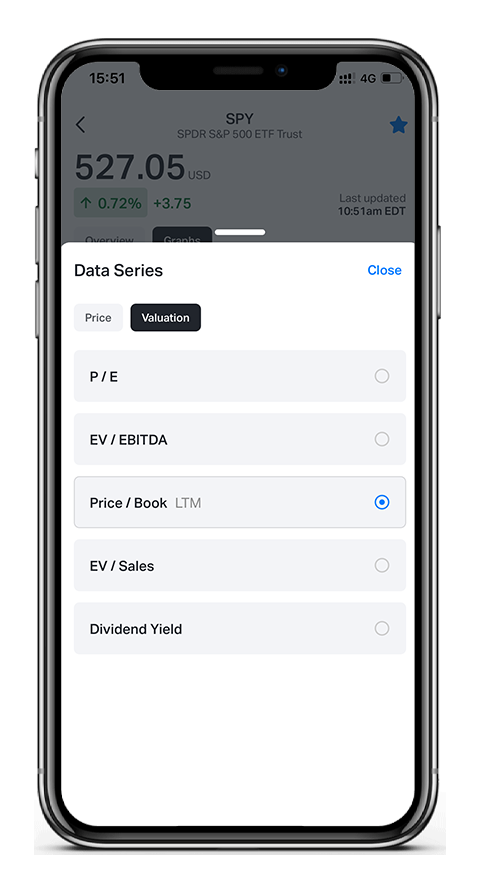
4. US ETF Valuation Graphs on Mobile
Valuation graphs for US ETFs are now also available on mobile. Track metrics like P/E, EV/EBITDA, Price/Book, EV/Sales, or Dividend Yield for your favorite ETFs, all while on the go.
Read more about Mobile App here.
5. Estimates for Primary Warrants
We've extended our coverage to include estimates data for Preferreds and Warrants.
Data for Preferreds and Warrants are available in Actuals & Consensus, Price Target, Estimates Overview, and Estimates Trends Snapshots.
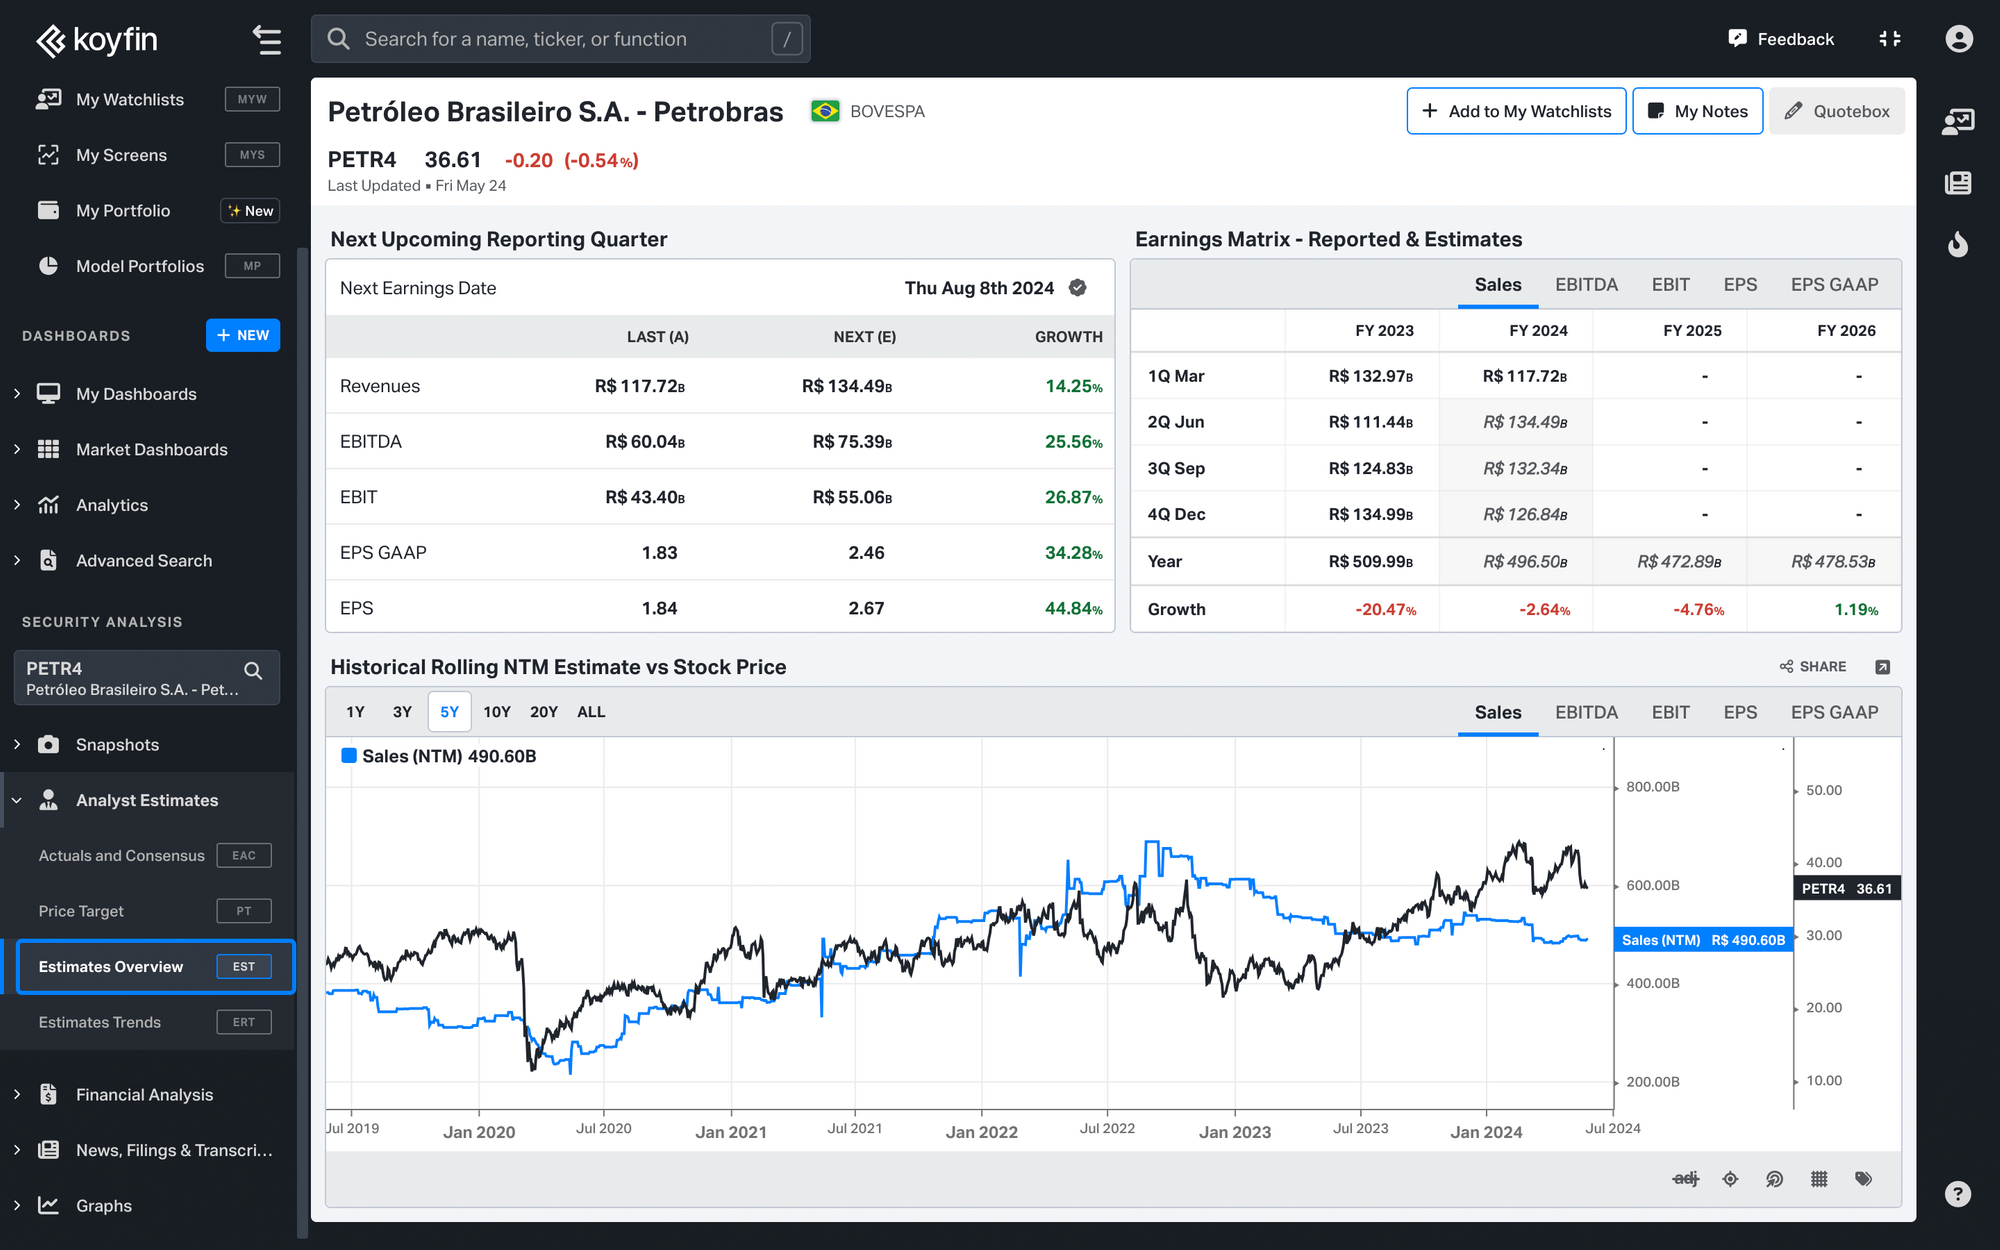
Explore this feature here.
6. Cycle through your watchlists in Graphs
You can quickly load a different security in graphs with your right sidebar actions. While on the Graph(G) function, open Watchlists on the right side of platform navigation, click on the row and it will be loaded into the graph.
Check this feature here.